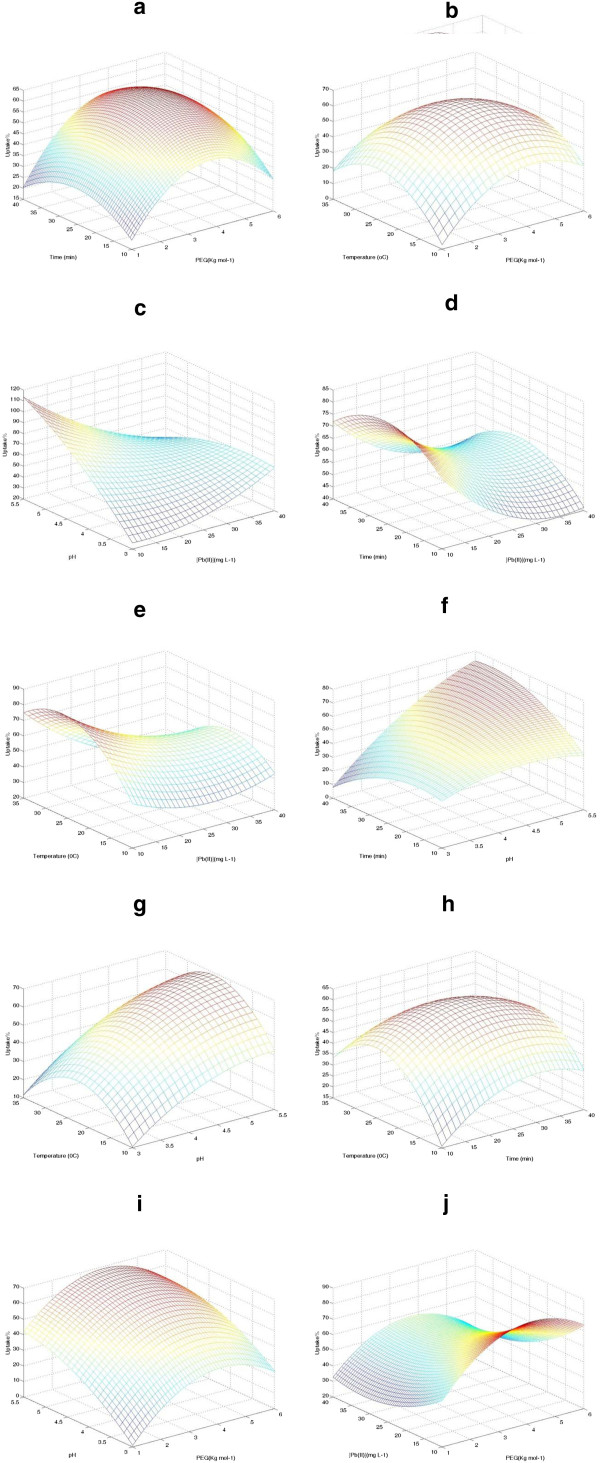
Figure 6.

Three dimensional figures. The 3-D plot of Pb(II) uptake predicted by the RSM model for (a) time and PEG (M), (b) temperature and PEG (M), (c) pH and Pb(II) concentration, (d) time and Pb(II) concentration, (e) temperature and Pb(II) concentration, (f) time and pH, (g) temperature and pH, (h) temperature and time, (i) pH and PEG (M), and (q) Pb(II) concentration and PEG M. In each figure, the remaining factors were kept constant at middle level values.
