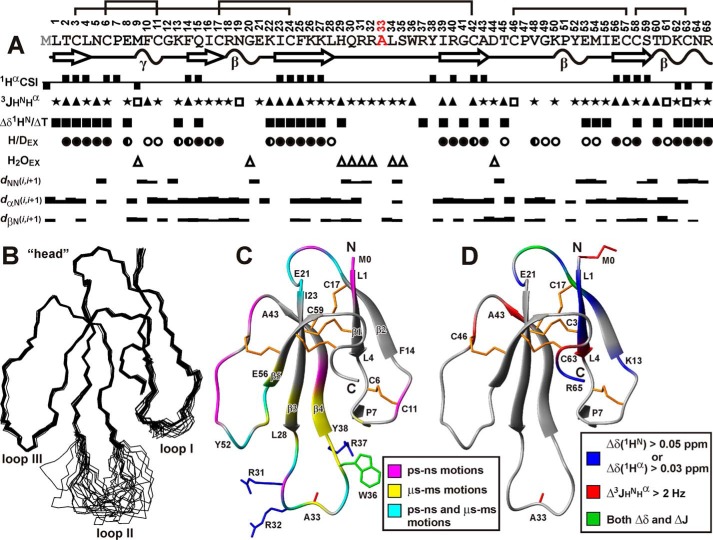
FIGURE 5.
Spatial structure and backbone dynamics of rWTX(P33A) in aqueous solution. A, overview of NMR data collected for rWTX(P33A). The positive and negative values of Hα chemical shift indices (CSIs) denote β-strand and α-helical propensity, respectively. The large (>8.5 Hz), small (<5 Hz), and medium (others) 3JHNHα coupling constants are designated by the filled triangles, open squares, and stars, respectively. The filled squares denote amide protons with temperature gradients (ΔδHN/ΔT) less than 4.5 ppb/K. The filled, half-open, and open circles denote HN protons with slow (half-exchange time >24 h), slow-intermediate (half-exchange time >1 h), and intermediate (half-exchange time >15 min) H-D exchange rates (H/DEX), respectively. Amide protons that demonstrate fast exchange with water protons (H2OEX) are shown by open triangles. The corresponding peaks were observed in a 20-ms CLEANEX-PM spectrum. The NOE connectivities are denoted as usual. The widths of the bars correspond to the relative intensity of the cross-peak in the 100-ms NOESY spectrum. Elements of secondary structure are shown on a separate line; the β-strands are designated by arrows and tight β/γ-turns by wavy lines. B, set of the best 20 rWTX(P33A) structures, superimposed over the backbone atoms in regions with well defined structure. The three loops and head of the toxin are labeled. C, ribbon representation of rWTX(P33A) spatial structure. The disulfide bonds are in orange. The side chains of mutated residues are shown. The ribbon of rWTX(P33A) is colored according to obtained dynamical NMR data (see supplemental Table). The residues affected by dynamic processes on the picosecond-nanosecond time scale (one with heteronuclear NOE <0.7 or S2 <0.8) or microsecond-millisecond time scale (having REX >2 Hz) are shown in magenta and yellow, respectively. The residues demonstrating mobility on both time scales are in cyan. D, qualitative data describing changes in the WTX conformation upon introduction of N-terminal Met residue (see Fig. 6, B and C) are mapped on the spatial structure of rWTX(P33A). The residues demonstrating large changes in backbone (1HN, 1Hα) chemical shifts or 3JHNHα coupling constants are shown in blue and red, respectively. The residues demonstrating both types of effects are in cyan. The side chains of Met-0 and Ala-33 are shown in red.

