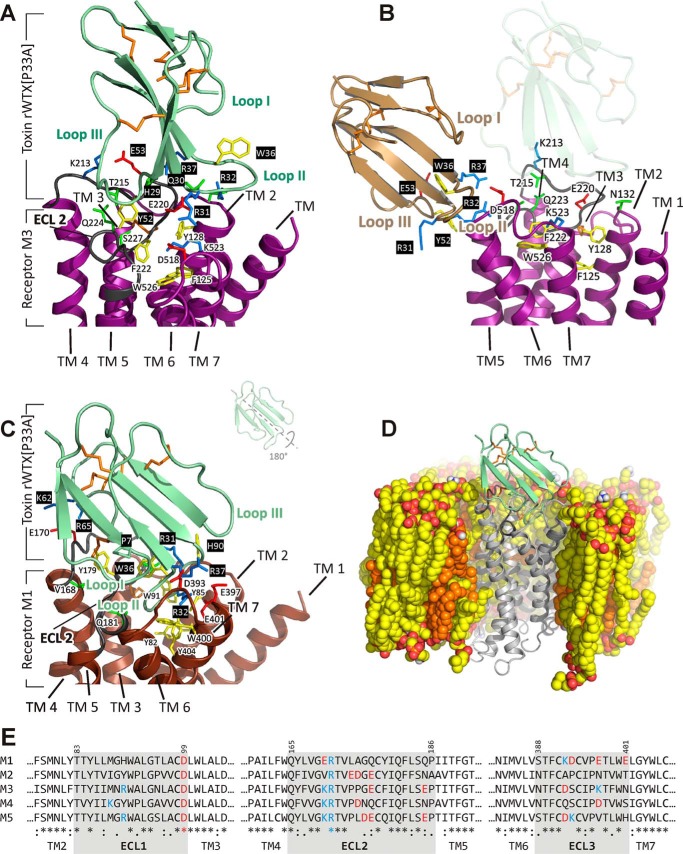
FIGURE 8.
Modeled complexes of rWTX(P33A) with M1- and M3-mAChRs. A, close-up view of rWTX(P33A) in complex with M3-mAchR (the structure from cluster 2 of solutions). Toxin molecule is shown in pale green, and the receptor is shown in purple. The M3-mAChR residues from ECL2 and ECL3 are shown. B, close-up view of rWTX(P33A) in complex with M3-mAChR (the structure from cluster 3 of solutions). Toxin molecule is shown in wheat, and the receptor is shown in purple. For comparison, the position of the toxin in cluster 2 of the solutions is shown by a shadow. C, close-up view of rWTX(P33A) (pale green) penetrating by the loop II into M1-mAChR (brown) TM helical bundle; ECL2 of the receptor (dark gray) leaves enough space for this interaction. The M1-mAChR residues that are critical for binding are shown. Negatively or positively charged, polar, and aromatic residues are in red, blue, green and yellow, respectively; toxin's residues are shown over a black background. Disulfide bonds are shown in orange. D, view of rWTX(P33A)·M1-mAChR complex in the POPC/POPE/cholesterol (2:1:1) bilayer after MD relaxation. Hydrophobic atoms of lipids and cholesterol are shown by yellow and orange, respectively. Oxygen and nitrogen atoms of phospholipids are shown by red and blue, respectively. The proximal parts of the membrane, water, and ions are removed for clarity. E, sequence comparison of ECLs in M1-M5 receptors.

