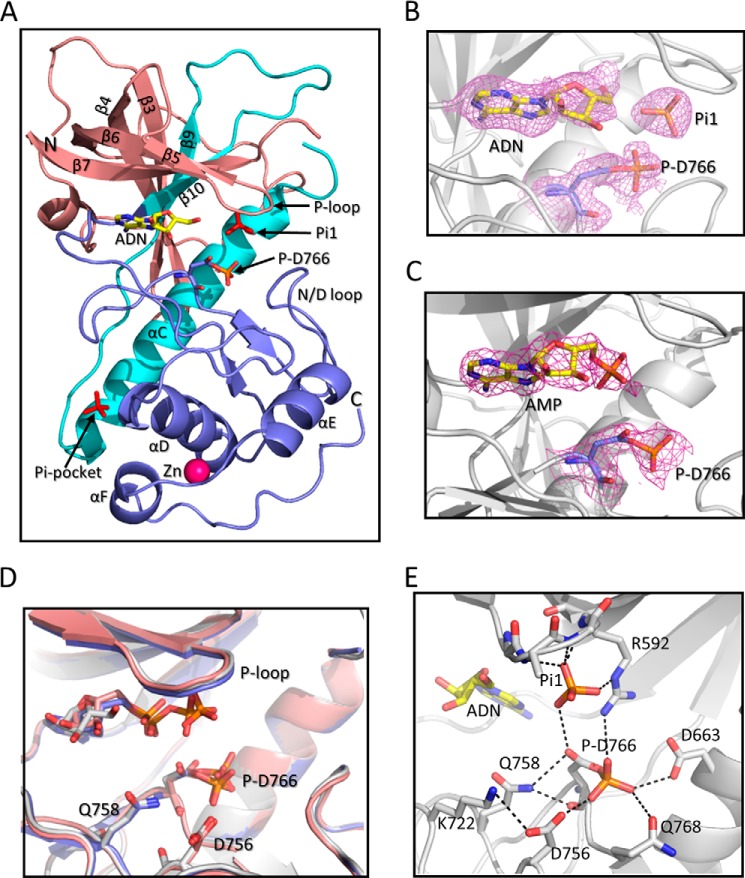
FIGURE 1.
Structure of A-CAT bound to adenosine or AMP. A, schematic representation of A-CAT bound to adenosine (A-CAT·ADN·P) with the N-terminal lobe (residues 552–655) colored salmon, the central core (residues 656–712) colored cyan, and the C-terminal lobe and tail (residues 713–842) colored blue. The N and C termini, β-sheets, and α-helices are labeled. Phosphate (Pi1), Asp(P)-766 (P-D766), and adenosine (ADN) are shown as sticks with the adenosine carbon atoms colored yellow. The zinc atom is shown as a magenta sphere. B and C, close-up views showing the catalytic cleft of A-CAT·ADN·P and A-CAT·AMP·P. Adenosine, AMP, Pi1, and Asp(P)-766 are shown as sticks. The mesh shows the 2Fo − Fc electron density map contoured at the 2σ level. D, alignment of the A-CAT·ADN·P (gray), A-CAT·AMP·P (salmon), and A-CAT·ADP·P (blue) structures shows that there is little or no change in the positions of the P-loop, N/D-loop, or key catalytic residues. E, view of the A-CAT·ADN·P active site showing the interactions (dashed lines) made by Asp(P)-766 and Pi1.

