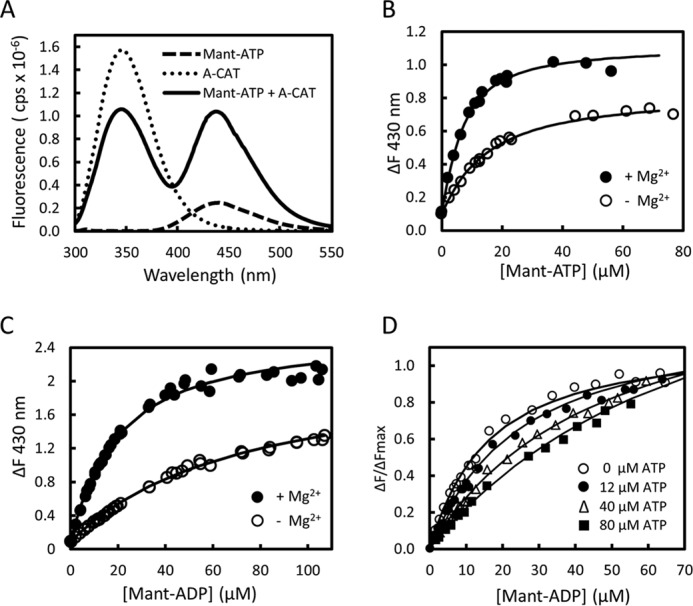
FIGURE 3.

Binding of mant-ADP and mant-ATP to A-CAT. A, fluorescence emission spectra obtained upon excitation at 280 nm were recorded for 28 μm mant-ATP (dashed line), 2 μm A-CAT (dotted line), and a mixture of 28 μm mant-ATP and 2 μm A-CAT (black line). Assays contained 2 mm MgCl2 and were carried out as described under “Experimental Procedures.” In the presence of A-CAT, there is a large increase in the fluorescence emission of mant-ATP in the 400–500 nm region. B and C, change in fluorescence emission at 430 nm (ΔF) was measured as mant-ATP (B) or mant-ADP (C) and titrated into a solution containing 2 μm A-CAT in the presence (●) or absence (○) of 2 mm MgCl2. The lines show the best fit of the data to a hyperbolic binding curve. D, change in fluorescence emission at 430 nm (ΔF) was measured as mant-ADP was titrated into solutions containing 2 μm A-CAT and 2 mm MgCl2 in the presence of 9, 12, 40, and 80 μm ATP. Decreased ΔF values reflect competition between ATP and mant-ADP for binding to A-CAT. The binding constants determined by fitting the data in B–D are listed in Table 4.
