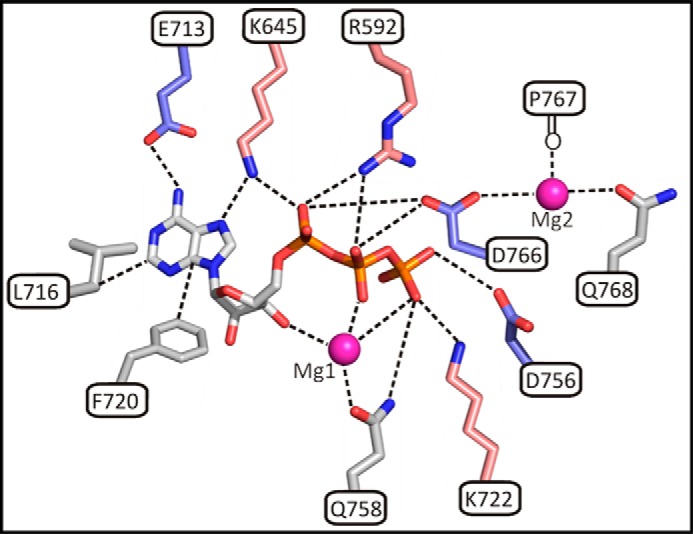
FIGURE 4.

Schematic diagram showing A-CAT interactions with ATP and Mg2+ ions. Residues in A-CAT that interact with ATP, Mg1, and Mg2 (magenta spheres) and that were examined in this study by site-directed mutagenesis are shown as sticks. Acidic residues are colored blue, and basic residues salmon and other residues are gray.
