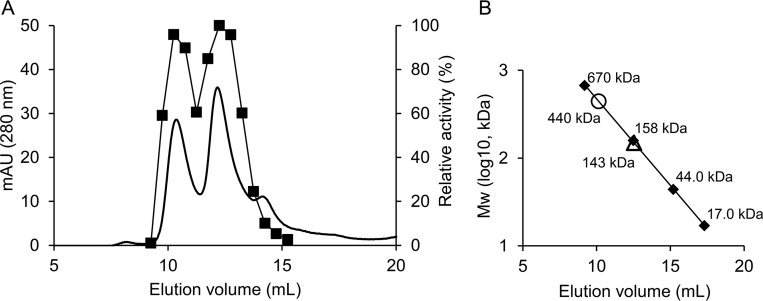
FIGURE 2.
Molecular weight of purified native EhPEPCKs. A, chromatograph of native EhPEPCKs on Superdex200. The optical absorbance at 280 nm is shown with a thick line, and the relative activity per volume of each fraction is shown with squares and a thin line. The highest activity per volume in all fractions was defined as 100%. B, estimation of molecular weight of the proteins corresponding to the two peaks in A (circle and triangle). Standard proteins are shown with diamonds.

