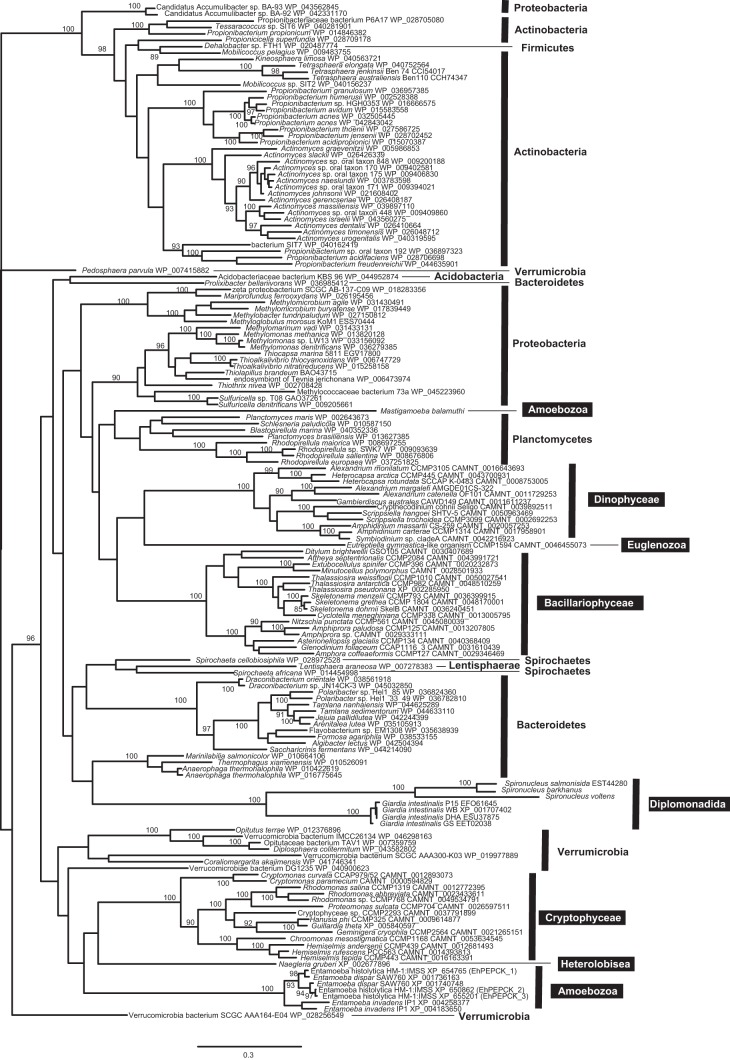
FIGURE 6.
Phylogenic tree of PPi-PEPCKs and their homologs. Sequences were aligned by MAFFT, and the data set was subjected to maximum likelihood analysis with RAxML version 7.2.8. Only bootstrap supports equal to or more than 85 are shown on each node. White letters in black boxes and black letters indicate eukaryotic and bacterial phyla, respectively.

