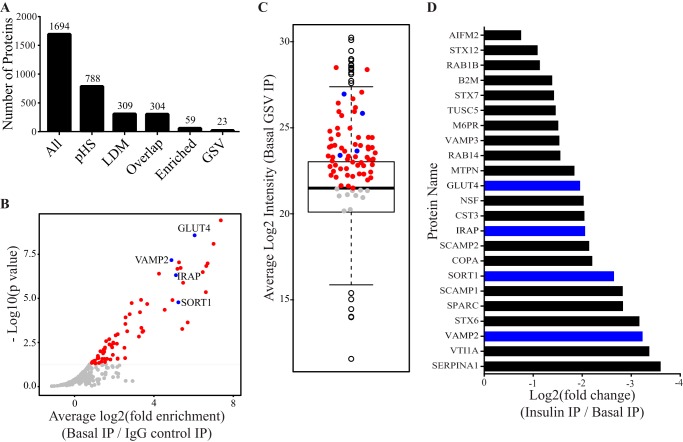
FIGURE 1.
Proteomic analysis of GLUT4 storage vesicles. A, number of protein groups carried through each filtering step of the analytical workflow (All, all proteins identified by mass spectrometry with known contaminants removed; pHS, proteins present in GSVs isolated from the pHS starting material (n = 2); LDM, proteins present in GSVs isolated from the LDM starting material (n = 2); Overlap, proteins identified in both LDM and pHS (n = 4); Enriched, proteins enriched within GSVs from unstimulated adipocytes with an average intensity greater than the median (n = 4, integrated p value < 0.05); GSV, enriched proteins that were also insulin-responsive (n = 4, integrated p < 0.05). B, volcano plot depicting proteins enriched within GSVs (red and blue points are proteins significantly enriched (n = 4, integrated p < 0.05)). Blue points represent known GSV proteins. C, boxplot of the average log2 LFQ intensities for all proteins present in GSVs from unstimulated adipocytes. Blue points represent known GSV proteins; red points represent enriched proteins (B) with average log2 LFQ greater than the population median; gray points are proteins below the median cutoff. D, fold response of 23 proteins that were enriched in GSVs and whose abundance decreased significantly following insulin treatment (n = 4, integrated p < 0.05). Blue bars highlight known GSV proteins. IP, immunoprecipitation.

