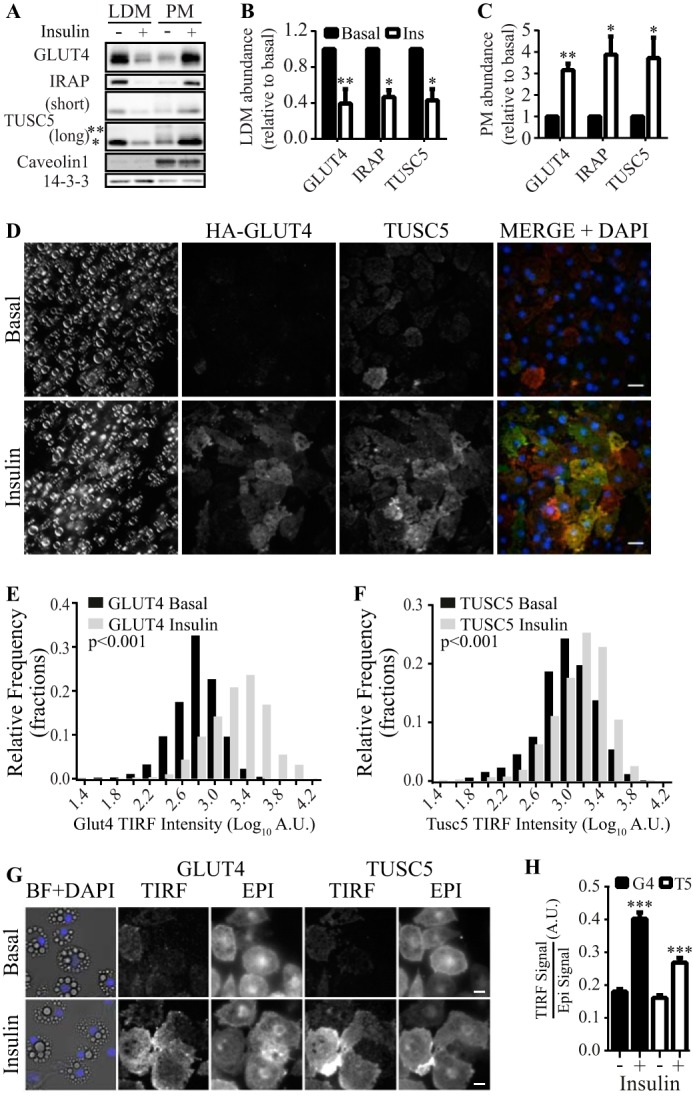
FIGURE 3.

TUSC5 translocates to the PM in response to insulin. A, levels of GLUT4, IRAP, and TUSC5 were determined in purified LDM and PM subcellular fractions by immunoblotting. Subcellular fractions were generated from 3T3-L1 adipocytes treated with and without insulin as indicated. Two exposure levels are presented for TUSC5 to permit visualization of higher molecular mass forms of TUSC5 (* = ∼20 kDa, and ** = ∼30 kDa). To control for loading and to assess purity of the fractions, we immunoblotted for 14-3-3 and Caveolin1 in both fractions. B, quantification of GLUT4, IRAP, and TUSC5 levels in the LDM fraction in A relative to levels in unstimulated cells (n = 3, mean ± S.E., unpaired t test, *, p < 0.05; **, p < 0.01, all comparisons with basal values; Ins, insulin). C, quantification of GLUT4, IRAP, and TUSC5 levels in the PM fraction in A relative to levels in unstimulated cells (n = 3, mean ± S.E., unpaired t test, *, p < 0.05; **, p < 0.01, all comparisons with basal values). Black and white bars denote levels under basal and insulin conditions, respectively, as in B. D, 3T3-L1 adipocytes were serum-starved for 2 h and treated with 100 nm insulin for 20 min where indicated prior to fixation and processing for imaging by bright field light microscopy and immunofluorescent imaging by TIRF microscopy. Nonpermeabilized cells were stained for nuclei (DAPI), TUSC5, and HA-GLUT4 with anti-HA antibody. Cells were visualized at ×63 magnification (scale bar, 20 μm). E, histogram showing the distribution of TIRF signal intensity for HA-GLUT4 under basal conditions (black bars) and following insulin stimulation (gray bars) (Kolmogorov-Smirnov test comparing distributions under basal and insulin conditions, p < 0.001). F, histogram showing the distribution of TIRF signal intensity for TUSC5 under basal conditions (black bars) and following insulin stimulation (gray bars) (Kolmogorov-Smirnov test comparing distributions under basal and insulin conditions, p < 0.001). G, 3T3-L1 adipocytes were serum-starved for 2 h and treated with 100 nm insulin for 20 min where indicated prior to fixation and processing for imaging by bright field light microscopy (BF) and immunofluorescent imaging by epifluorescent (EPI) and TIRF microscopy (TIRF). Permeabilized cells were stained for nuclei (DAPI), TUSC5, and HA-GLUT4 with anti-HA antibody. Cells were visualized at ×63 magnification (scale bar, 20 μm). H, average TIRF signal/epifluorescent signal ratios for GLUT4 (black bars) and TUSC5 (white bars) under basal and insulin conditions as indicated (data from 158 to 295 cells from 10 regions of interest per condition from two independent experiments, mean ± S.E., Kolmogorov-Smirnov test, ***, p < 0.001). A.U., arbitrary units.
