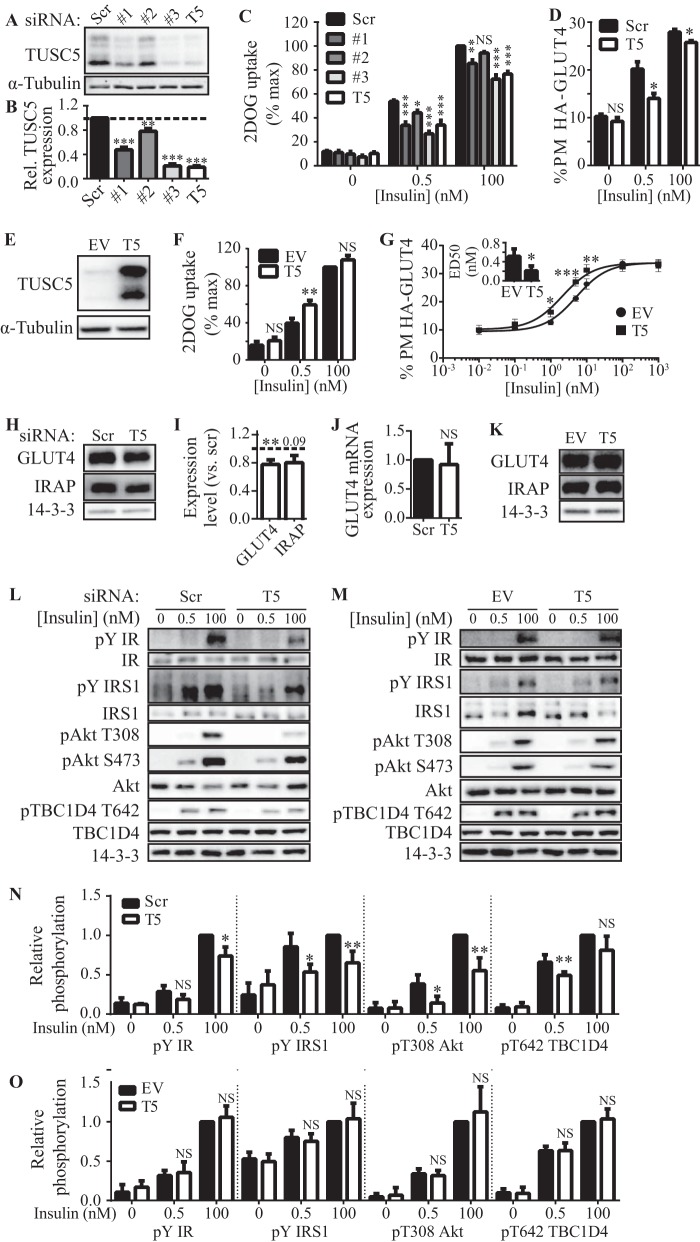
FIGURE 4.
TUSC5 is a positive regulator of insulin-stimulated GLUT4 trafficking. A, total cell lysates from 3T3-L1 adipocytes treated with scrambled (Scr) or a panel of three different anti-Tusc5 siRNAs (#1, #2, and #3), or a pool of all three siRNAs (T5) were immunoblotted for TUSC5 to determine the extent of TUSC5 knockdown. B, TUSC5 levels (in A) were quantified by densitometry and expressed as relative to cells treated with scrambled (Scr) siRNA (n = 4, mean ± S.E. one-way ANOVA; **, p < 0.01; ***, p < 0.001). C, 3T3-L1 adipocytes were treated with scrambled or individual anti-Tusc5 siRNAs (#1, #2, and #3) or a pool of siRNAs (T5) for 96 h before 2DOG uptake assays were performed at the insulin doses indicated. 2DOG uptake expressed as a percentage of the maximum response in cells treated with scrambled siRNA (n = 4, mean ± S.E., two-way ANOVA; NS, nonsignificant; *, p < 0.05; **, p < 0.01; ***, p < 0.001, comparisons with control (scr) cells treated with the same insulin dose). D, PM levels of HA-GLUT4 in 3T3-L1 adipocytes overexpressing HA-GLUT4 treated with scrambled (Scr) or pooled Tusc5 (T5) siRNA was measured using a fluorescence-based assay. Adipocytes were treated with insulin as indicated (n = 3, mean ± S.E., two-way ANOVA; NS, nonsignificant; *, p < 0.05, comparisons with control (scr) cells treated with the same insulin dose). E, retroviral overexpression of TUSC5 was assessed by immunoblotting whole cell lysates from cells expressing a control vector (empty vector, EV) or overexpressing TUSC5. α-Tubulin levels were determined as a loading control. F, 3T3-L1 adipocytes expressing a control vector (EV) or overexpressing TUSC5 were subjected to 2DOG uptake assays at the insulin doses indicated. 2DOG uptake expressed as a percentage of the maximum response in cells expressing control vector (EV) (n = 4, mean ± S.E., two-way ANOVA; NS, nonsignificant; **, p < 0.01, comparisons with cells expressing control vector (EV) treated with the same insulin dose). G, PM levels of HA-GLUT4 in 3T3-L1 adipocytes overexpressing HA-GLUT4 in combination with a control vector (EV) or TUSC5 were measured using a fluorescence-based assay. PM HA-GLUT4 levels in adipocyte-treated insulin doses as indicated were plotted as a dose-response curve (n = 3, mean ± S.E., two-way ANOVA; NS, nonsignificant; *, p < 0.05; **, p < 0.01; ***, p < 0.001 comparisons with cells expressing control vector (EV) treated with the same insulin dose). ED50 values for PM-GLUT4 were determined from nonlinear fitting of dose curves and graphed as an inset (n = 3, ± S.E., unpaired t test; *, p < 0.05, compared with cells expressing empty vector (EV)). H, GLUT4, IRAP, and 14-3-3 (loading control) levels were assessed by immunoblotting whole cell lysates from control (scr) and TUSC5 knockdown cells. I, GLUT4 and IRAP levels (H) were quantified by densitometry and are expressed as relative to control (scr) cells (n = 3, mean ± S.E., unpaired t test, **, p < 0.01, all comparisons with cells treated with scrambled siRNA; dotted line represents levels in cells treated with scrambled siRNA). J, mRNA expression of Glut4 was determined by qPCR in cells treated with scrambled (Scr) and pooled anti-Tusc5 (T5) siRNA. Data were expressed relative to levels in cells treated with scrambled siRNA (n = 3, mean ± S.E., unpaired t test; NS, nonsignificant, compared with cells treated with scrambled siRNA). K, levels of GLUT4, IRAP, and 14-3-3 (loading control) were assessed by immunoblotting whole cell lysates from control (EV) cells and cells overexpressing TUSC5. L, insulin signaling was monitored at the level of phosphorylation of insulin receptor (pIR), IRS1 (pIRS1), Thr(P)-308 and Ser(P)-473 AKT and Thr(P)-642 TBC1D4 in response to 0.5 and 100 nm insulin in control (scr) cells and cells treated with TUSC5 siRNA. Total levels of insulin receptor (IR), IRS1, AKT, and TBC1D4 were assessed in all conditions, and 14-3-3 was used as loading control. M, insulin signaling was monitored at pIR, pIRS, Thr(P)-308 and Ser(P)-473 AKT, and Thr(P)-642 TBC1D4 in response to 0.5 and 100 nm insulin in control (EV) cells and cells overexpressing TUSC5. Total levels of IR, IRS, AKT, and TBC1D4 were assessed in all conditions, and 14-3-3 was used as loading control. N, quantification of signaling intermediates in L. All data are expressed relative to substrate phosphorylation in response to 100 nm insulin in control (scr) cells (n = 3–5, mean ± S.E., unpaired t test; NS, nonsignificant; *, p < 0.05; **, p < 0.01, comparisons with cells expressing treated with scrambled siRNA under the same treatment conditions). O, quantification of signaling intermediates in M. All data are expressed relative to substrate phosphorylation in response to 100 nm insulin in control (EV) cells (n = 3, mean ± S.E., unpaired t test; NS, nonsignificant, comparisons with cells expressing treated with scrambled siRNA under the same treatment conditions).

