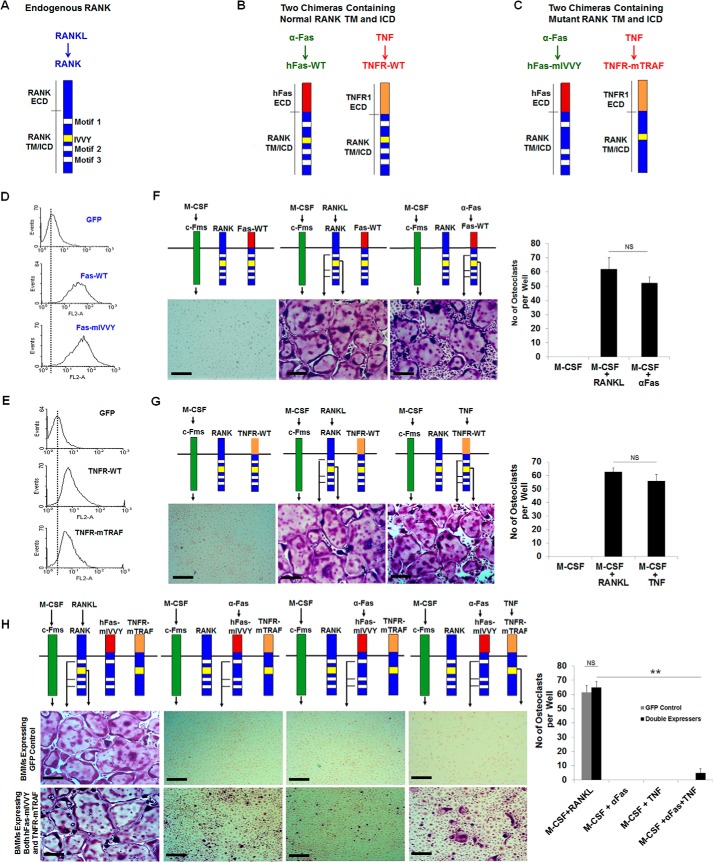
FIGURE 2.
The IVVY motif and the TRAF sites need to be on the same RANK molecule to promote osteoclastogenesis. A, schematic of RANK. ECD, extracellular domain; TM, transmembrane domain; ICD, intracellular domain. B, schematic of hFas-WT and TNFR-WT. C, schematic of hFas-mIVVY and TNFR-mTRAF. D, flow cytometric analysis of BMMs from TNFR1−/−R2−/− mice expressing GFP, hFas-WT, or hFas-mIVVY and TNFR-mTRAF. E, flow cytometric analysis of BMMs from TNFR1−/−R2−/− mice expressing GFP, TNFR-WT, or hFas-mIVVY and TNFR-mTRAF. F, BMMs expressing hFas-WT were treated with M-CSF (44 ng/ml) alone, M-CSF (44 ng/ml) and RANKL (100 ng/ml), or M-CSF (44 ng/ml) and α-Fas (100 ng/ml) for 5 days. G, BMMs expressing TNFR-WT were treated with M-CSF (44 ng/ml) alone, M-CSF (44 ng/ml) and RANKL (100 ng/ml), or M-CSF (44 ng/ml) and TNF (100 ng/ml) for 5 days. H, BMMs expressing GFP control or hFas-mIVVY and TNFR-mTRAF were treated with M-CSF (44 ng/ml) and RANKL (100 ng/ml), M-CSF (44 ng/ml) and α-Fas (100 ng/ml), M-CSF (44 ng/ml) and TNF (100 ng/ml), or M-CSF (44 ng/ml) and TNF (100 ng/ml) plus α-Fas (100 ng/ml) for 5 days. The cultures were stained for TRAP activity on day 5. Quantification of the osteoclast formation assays in F–H is shown in the right panels as the mean number of multinucleated TRAF-positive cells (>3 nuclei) per well. Data are mean ± S.D. **, p < 0.001; NS, not significant. Scale bars = 200 μm.

