FIGURE 4.
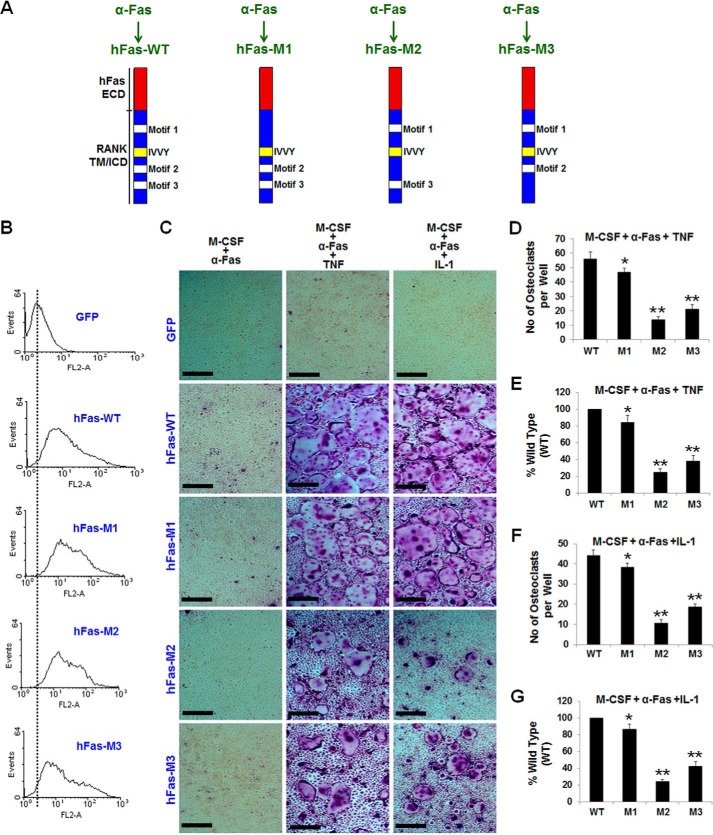
The RANK functional TRAF motifs exert different effects on TNF/IL-1-mediated osteoclastogenesis. A, schematic of hFas-WT, hFas-M1, hFas-M2, and hFas-M3. ECD, extracellular domain; TM, transmembrane domain; ICD, intracellular domain. B, flow cytometric analysis of BMMs expressing GFP, hFas-WT, hFas-M1, hFas-M2, or hFas-M3. C, BMMs expressing GFP, hFas-WT, hFas-M1, hFas-M2, or hFas-M3 were treated with M-CSF (44 ng/ml) and α-Fas (10 ng/ml), M-CSF (44 ng/ml) and α-Fas (10 ng/ml) plus TNF (5 ng/ml), or M-CSF (44 ng/ml) and α-Fas (10 ng/ml) plus IL-1 (5 ng/ml) for 5 days. BMMs expressing GFP or hFas-WT were used as negative and positive controls, respectively. The cultures were stained for TRAP activity on day 5. Scale bars = 200 μm. D and E, quantification of the osteoclastogenesis assays induced by TNF is shown in mean number (D) or mean percentage (E) of multinucleated TRAP-positive cells (<3 nuclei) per well. F and G, quantification of the osteoclastogenesis induced by IL-1 is shown in mean number (F) or mean percentage (G) of multinucleated TRAP-positive cells (>3 nuclei) per well. Data are mean ± S.D. *, p < 0.05; **, p < 0.001.

