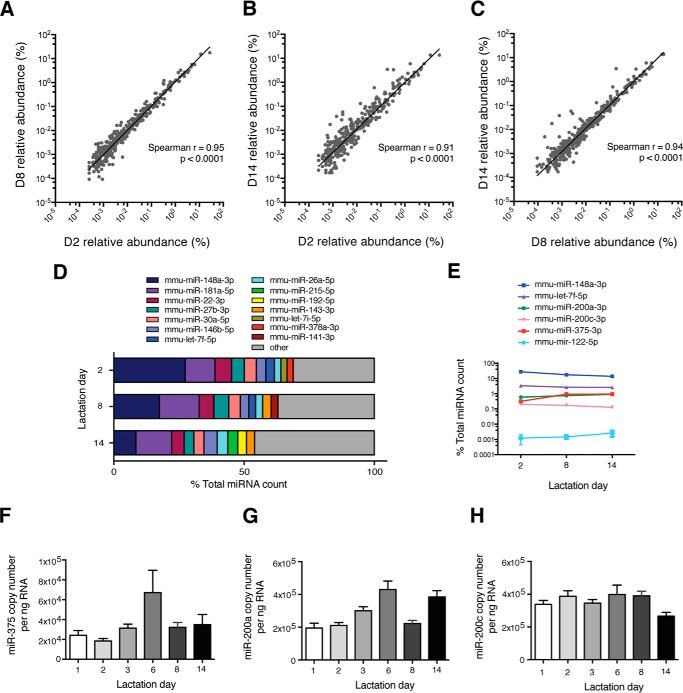
FIGURE 1.
Characterization of miRNAs in murine milk. A–C, scatter plots depicting the pairwise comparison of global miRNA sequencing profiles in milk at D2, D8, and D14 of lactation (n = 2/lactation day): D2 versus D8 (A), D2 versus D14 (B), and D8 versus D14 (C). D, the top 10 most highly expressed miRNAs in milk as determined by sequencing per lactation day. E, expression profile across lactation days of select miRNAs (n = 2). A–E, unique miRNAs are expressed as percent of total miRNA count. F–H, copy number per nanogram of RNA of miR-375 (F), miR-200a (G), and miR-200c (H) in WT milk throughout lactation (n = 4–6). E–H, results are represented as mean ± S.E.

