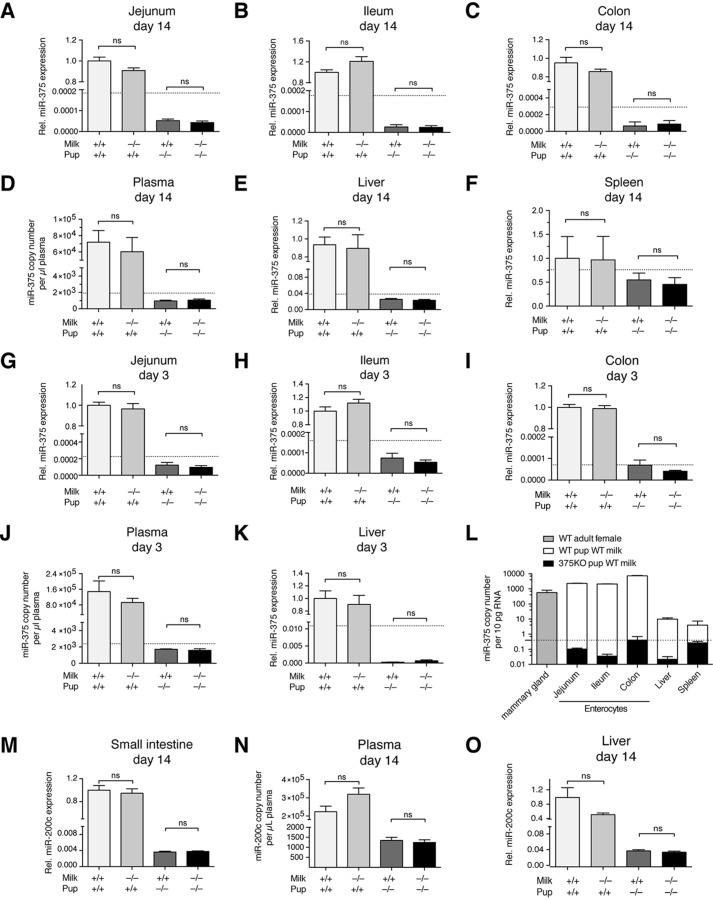
FIGURE 3.
miR-375 and miR-200c are not taken up into offspring tissues or blood. A–K, relative (Rel) miR-375 expression or copy number per microliter of plasma in D14 upper enterocytes (jejunum) (WT pups, n = 8; KO pups, n = 6) (A), D14 lower enterocytes (ileum, n = 8) (B), D14 colon enterocytes (n = 8) (C), D14 plasma (WT pups, n = 10; KO pups, n = 7) (D), D14 liver (n = 14) (E), D14 spleen (n = 9) (F), D3 jejunum (WT pups, n = 8; KO pups, n = 6) (G), D3 ileum (WT pups, n = 8; KO pups, n = 6) (H), D3 colon enterocytes (WT pups, n = 8; KO pups, n = 6) (I), D3 plasma (n = 6–8) (J), and D3 liver (WT pups, n = 14; KO pups, n = 8) (K). L, tissue panel comparing endogenous miR-375 level/10 pg of RNA (roughly one cell), represented by WT pups receiving WT milk, and exogenous miR-375 level, represented by 375KO pups receiving WT milk (n = 6–10). M–O, relative miR-200c expression or copy number per microliter of plasma in D14 small intestine enterocytes (n = 20) (M), D14 plasma (n = 8) (N), and D14 liver (n = 10) (O). Relative expression was calculated using the ddCt method with sno202 as an internal normalizer and setting WT pup WT milk as 1. Copy number per microliter of plasma was normalized to spiked-in cel-miR-39. The dotted lines represent the detection limit of the qPCR. Values represent mean ± S.E. *, p ≤ 0.05; **, p < 0.01; ***, p < 0.001; ns, p > 0.05.

