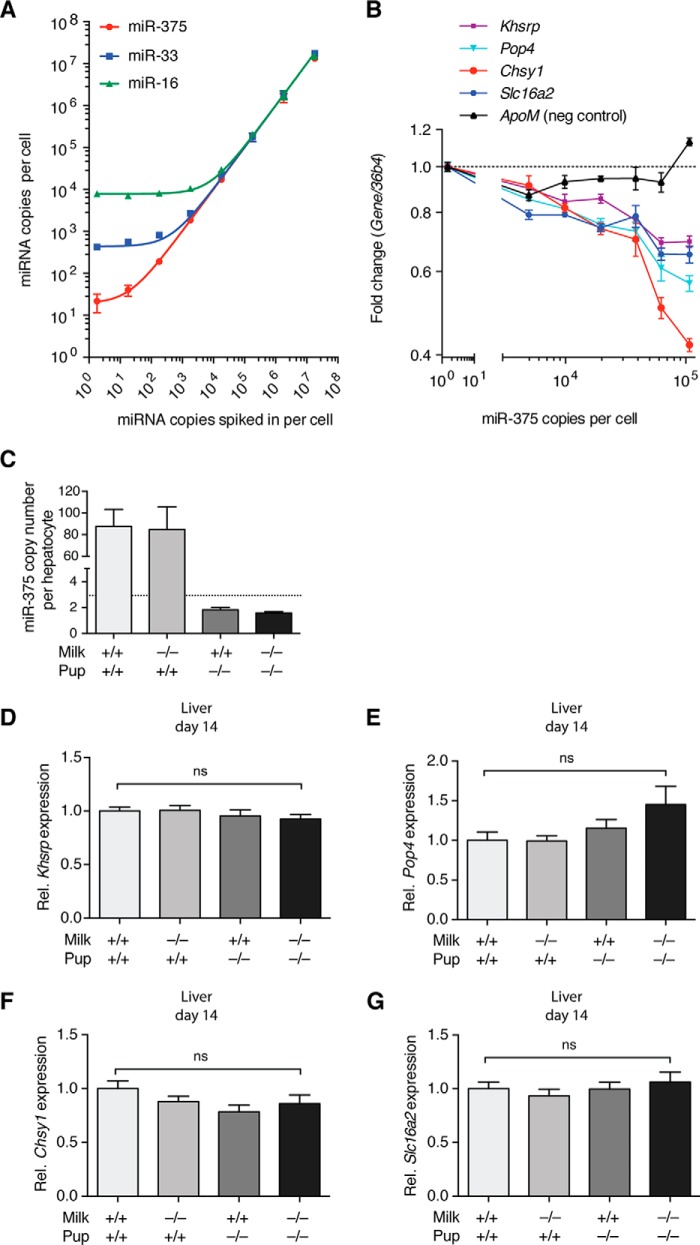
FIGURE 4.
Evaluation of miR-375 target gene regulation using hepatocytes as a model. A, standard curve built by spiking non-infected hepatocytes with serially diluted synthetic miR-375 (n = 3). The copy number detected was on the basis of a standard curve prepared in water. miR-33 and miR-16 were used as controls for linearity. B, miR-375 target gene fold-change relative to miR-375 copy number in Ad-miR-375-infected hepatocytes. miR-375 copies per cell represent detected copies in virus-infected hepatocytes of a multiplicity of infection of 0–50 (n = 4) on the basis of the standard curve in A, with relative target gene expression normalized to a multiplicity of infection of 0. ApoM was used as a negative (neg) control. C, the estimated copy number of miR-375 in D14 offspring liver cells calculated following the assumption that one hepatocyte contains 73.5 pg of RNA (n = 14). The dotted line represents the detection limit of the qPCR. D–G, expression of miR-375 targets Khsrp (D), Pop4 (E), Chsy1 (F), and Slc16a2 (G) in D14 offspring livers from the miR-375 pup exchange (n = 17–19). Relative target gene expression was calculated using the ddCt method, with 36b4 as an internal normalizer and WT milk WT pup set as 1. Results represent mean ± S.E. *, p ≤ 0.05; **, p < 0.01; ***, p < 0.001; ns, p > 0.05.

