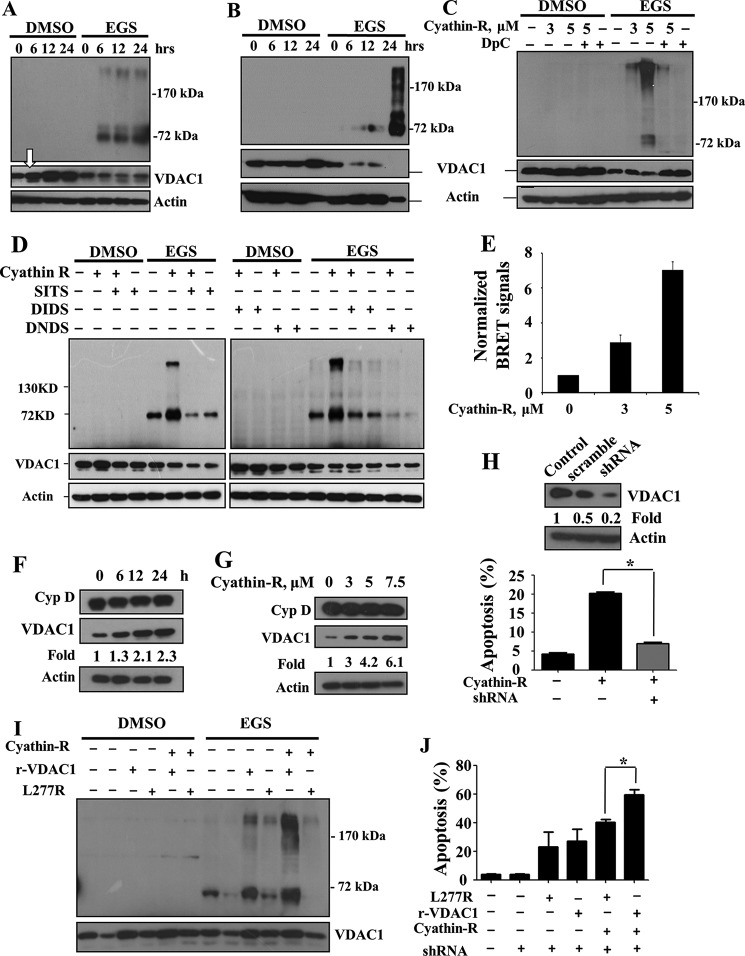
FIGURE 5.
Cyathin-R elevates VDAC1 levels and oligomerization coupled with apoptosis induction. A–D, Bax−/−/Bak−/− MEFs (A) and Bax−/− HCT116 (B) were treated with cyathin-R at the indicated times, or Bax−/−/Bak−/− MEFs were pretreated for 1 h with 0.5 mm DpC (C), SITS, DIDS, or DNDS (D), incubated with cyathin-R, and then cross-linked with EGS. VDAC1 levels and oligomerization were analyzed by immunoblotting, with the arrow in A pointing to the increase in VDAC1 expression level. E, cyathin-R-induced VDAC1 oligomerization detection by BRET2. Bax−/−/Bak−/− MEFs were co-transfected with siRNA specific to human VDAC1-encoding (50 nm), rVDAC1-Rluc-encoding (0.2 μg), and rVDAC1-GFP2-encoding (0.8 μg) plasmids. As a control, cells were co-transfected with the VDAC1-Rluc-encoding plasmid and siRNA for hVDAC1. Twenty-four h later, the cells were treated with cyathin-R (3 or 5 μm, 24 h) or with the relevant amount of DMSO. Luciferase and GFP signals were measured following 48 h of transfection. The ratios of the bioluminescence resonance energy transfer (BRET) signals were calculated as described. Luciferase activity was measured following the addition of the substrate, DeepBlue C, as luminescent, whereas GFP fluorescence was measured at 510 nm. All readings were performed with an Infinite 200 ELISA reader. F and G, Bax−/−/Bak−/− MEFs were treated with 5 μm cyathin-R and cyclophilin D (Cyp D), and VDAC1 levels were analyzed by Western blotting. Quantitative analysis of VDAC1 levels are presented as -fold increase. H, Bax−/− HCT116 cells stably expressing human VDAC1-shRNA to down-regulate VDAC1 levels or scrambled shRNA (Western blot at the top) were incubated with cyathin-R (5 μm, 24 h) and analyzed for apoptosis. Means ± S.E. (error bars) (n = 3) are presented. I and J, stable human VDAC1 knockdown Bax−/− HCT116 cells were transfected to express native or L277R mutant rat VDAC1. Twenty-four h later, the cells were treated with 5 μm cyathin-R. Aliquots were analyzed for VDAC1 levels and oligomerization by Western blotting (I). A second set of cell aliquots was analyzed by annexin-V/PI staining (J). Means ± S.E. (n = 3) are reported. *, p < 0.05.

