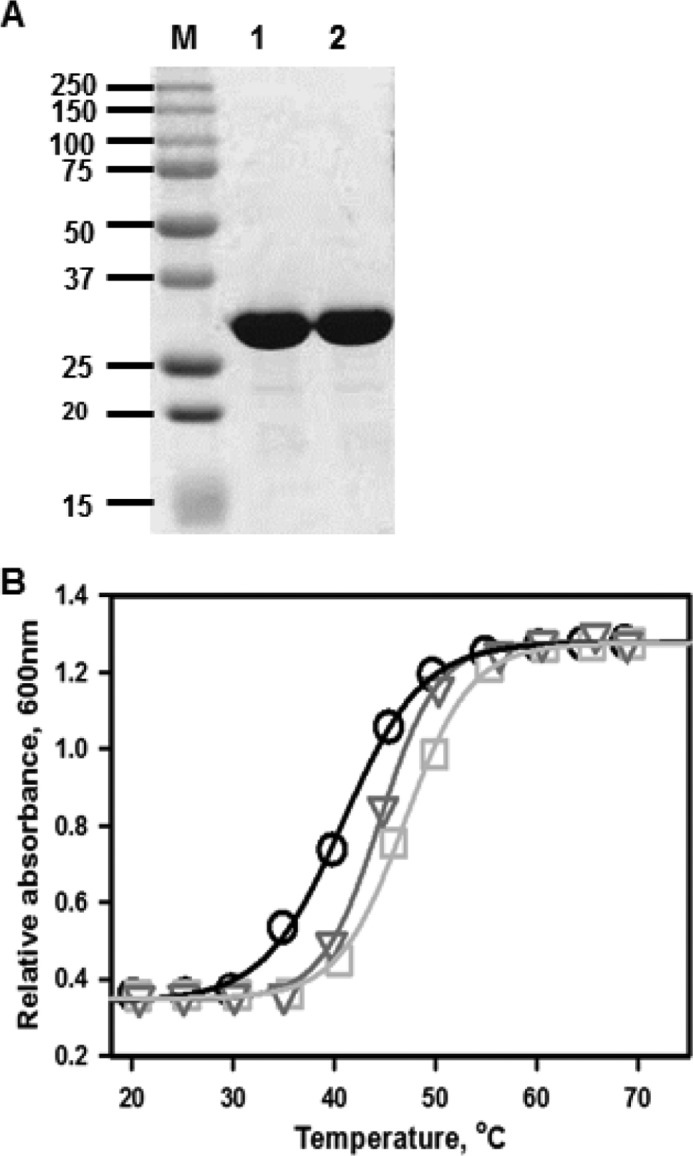
FIGURE 2.

Purity and stabilities of the rhodanese variants. A, SDS-PAGE analysis of E102D (lane 1) and P285A (lane 2) variants of human rhodanese. The molecular mass markers are shown in the lane labeled M. B, thermal melting curves for wild-type rhodanese (circles), E102D (squares), and P285A (triangles) were monitored by turbidometric analysis at 600 nm of protein solutions (0.5 mg/ml) in 100 mm HEPES, pH 7.4, containing 150 mm NaCl buffer as described under “Experimental Procedures.” The data are representative of three independent experiments.
