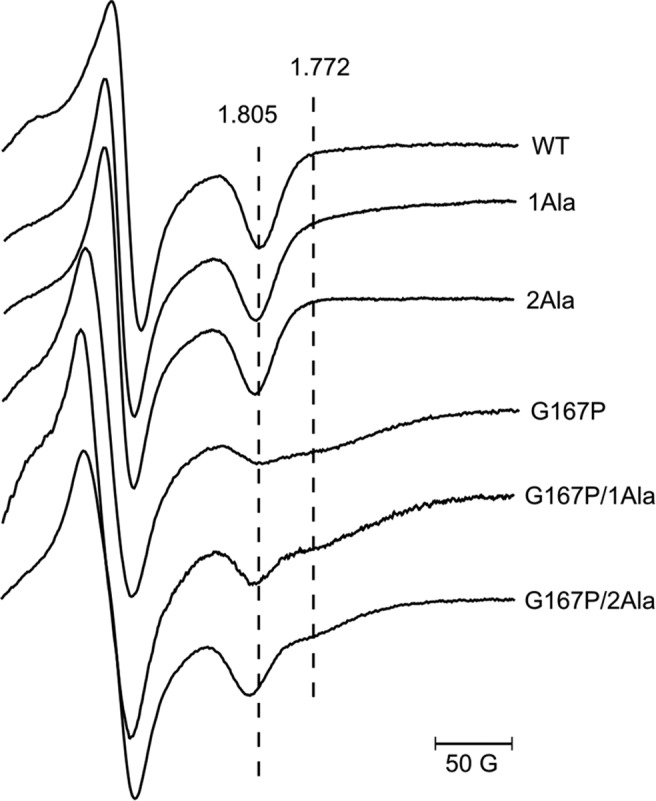
FIGURE 7.

X-band CW EPR spectra of [2Fe-2S] cluster of WT and various mutants. All EPR spectra were measured in chromatophores suspended in 50 mm MOPS (pH 7) and 100 mm KCl and reduced with ascorbate. Dotted lines indicate the position of [2Fe-2S] gx transitions.
