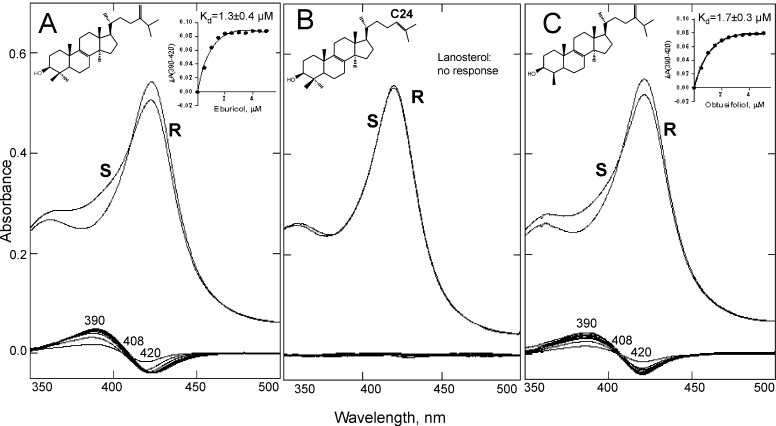
FIGURE 5.
Spectral responses of A. fumigatus CYP51B to the addition of sterols. A, eburicol. B, lanosterol. C, obtusifoliol. Absolute (top) and difference (bottom) absorbance spectra are shown. S, sample; R, reference. P450 concentration was 5 μm, and optical path length was 1 cm. The titration curves (obtained using Equation 1) are shown in the insets, and the Kd values are corrected for cyclodextrin binding. The C24-methylene group appears to be required for the proper binding of sterol substrates to A. fumigatus CYP51B.

