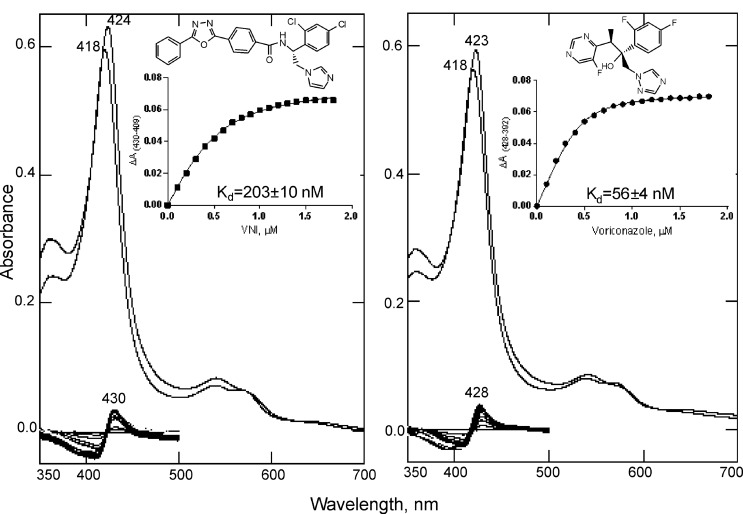
FIGURE 6.
Spectral response of A. fumigatus CYP51B to the addition of the heme-coordinating ligands VNI and voriconazole. Absolute (top) and difference (bottom) absorbance spectra are shown. The P450 concentration was 1.0 μm, and the optical path length was 5 cm. The titration curves (obtained using Equation 1) are shown in the inset.

