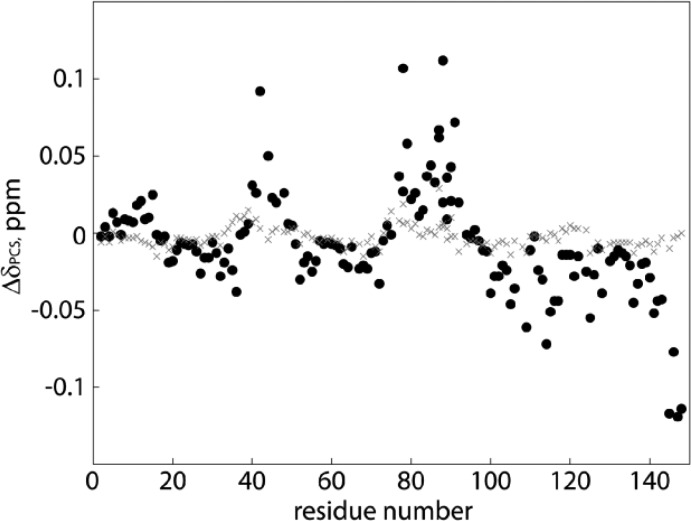
Figure 4.
Calmodulin lobe δPCS induced by Dy3+ labeled sevoflurane and control ligands. Amide proton δPCS in ppm versus sequence for 0.1 mM calmodulin lobes, consecutively plotted, in the presence of 0.1 mM of either the sevoflurane ligand (black, filled circles) or control compound (grey crosses) complexed to Dy3+.

