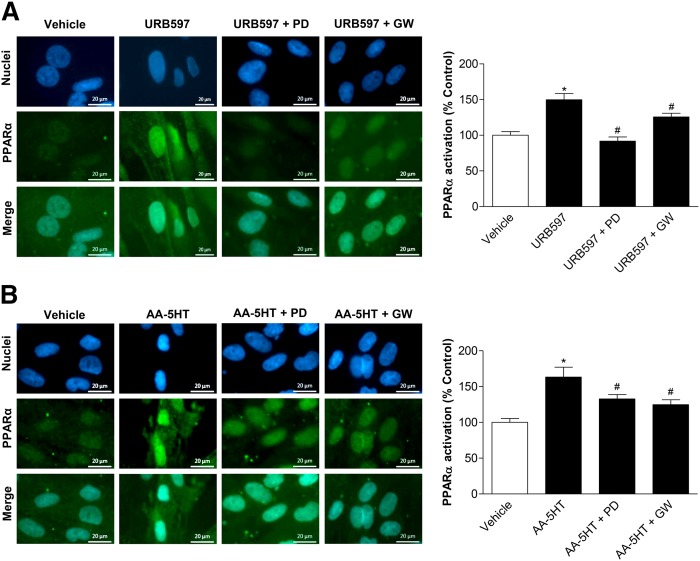
Fig. 6.
Impact of p42/44 MAPK on URB597- and AA-5HT-induced PPARα activation. A, B: MSCs were pretreated with the upstream inhibitor of p42/44 MAPK activation, PD98059 (10 μM), or the PPARα antagonist, GW6471 (GW) (10 μM), for 1 h and subsequently incubated with URB597 (A, 10 μM) or AA-5HT (B, 10 μM) for another 2 h. PPARα activation was quantified by measuring colocalization of PPARα and nuclear regions of MSCs. Immunocytochemical staining of PPARα was carried out by hybridiziation of fixed cells with a PPARα antibody and subsequent staining using an Alexa Fluor® 488 dye-conjugated anti-mouse IgG secondary antibody. Nuclear regions were visualized by the DNA intercalating fluorescent dye, bisbenzimide. Nuclear PPARα was quantified by merging nuclear regions with PPARα fluorescence intensity. For quantitative analyses of PPARα detected in nuclear regions, fluorescence at 488 nm excitation of n = 45–65 nuclei (A, two donors) or n = 44–51 nuclei (B, two donors) was measured using the Zeiss Zen Pro 2012 analysis software. Pictures show representative images of nuclear regions (blue), PPARα (green), and PPARα merged to nuclei, respectively. Percent control represents PPARα fluorescence in nuclear regions indicated as mean ± SEM in comparison to vehicle-treated cells (100%) in the absence of test substances using cells obtained from one donor. *P < 0.05 versus vehicle control; #P < 0.05 versus the respective FAAH inhibitor in the absence of antagonists, one-way ANOVA plus post hoc Bonferroni test.

