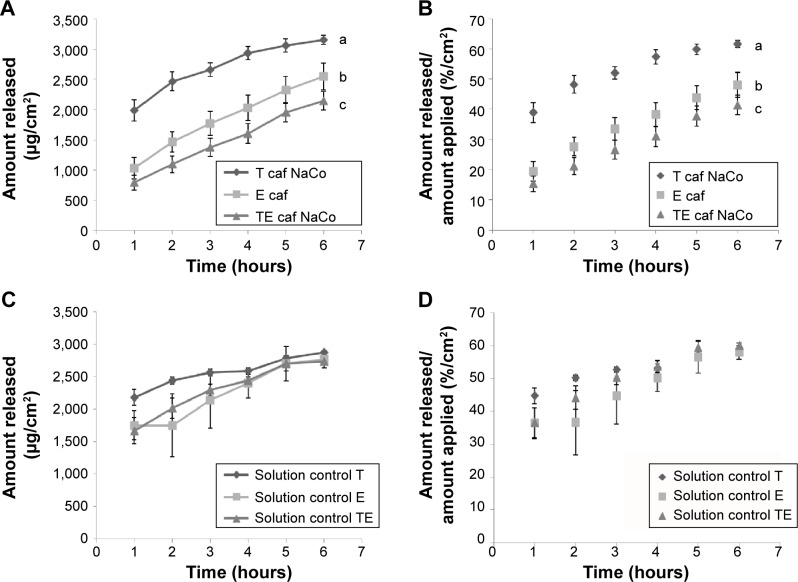
Figure 7.
(A) Cumulative amount of caffeine UDV formulation (prepared with sodium cholate) released over 6 hours, expressed as mean ± SD. (n=6 per formulation). (B) Cumulative amount of caffeine UDV formulation (prepared with sodium cholate) released over 6 hours relative to the applied amount, expressed as mean ± SD (n=6 per formulation). (C) Cumulative amount of Caffeine solution controls released over 6 hours, expressed as mean ± SD (n=3 per control). (D) Cumulative amount of caffeine solution controls released over 6 hours relative to the applied amount, expressed as mean ± SD (n=3 per control).
Notes: Statistical analysis: two-way analysis of variance with duplicates and all pairwise multiple comparison procedures; means with different letters (a,b and c) are significantly different (P<0.05).
Abbreviations: E caf, caffeine-loaded ethosomes; Solution Control E, control solution for ethosomes; Solution Control T, control solution for transfersomes; Solution Control TE, control solution for transethosomes; SD, standard deviation; T caf NaCo, caffeine-loaded sodium cholate transfersomes; TE caf NaCo, caffeine-loaded sodium cholate transethosomes; UDV, ultradeformable vesicles.

