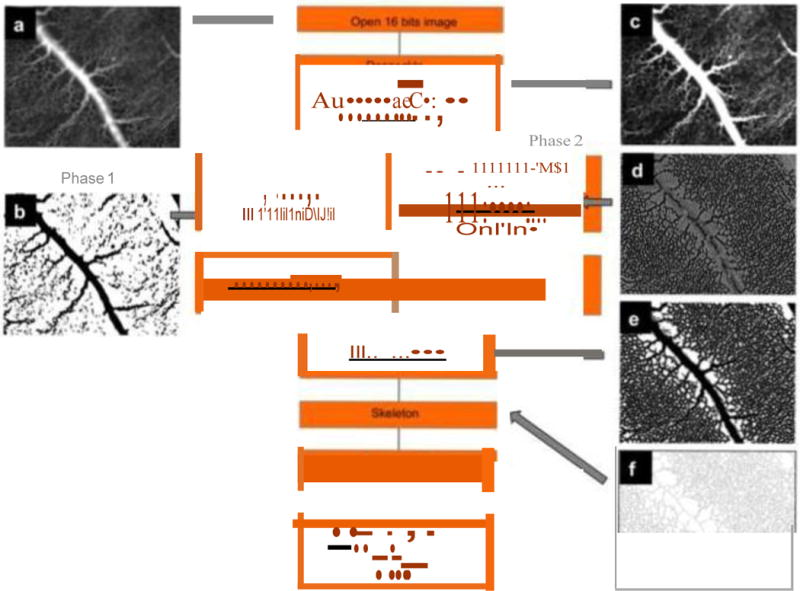
Figure 11.

Schematic representation of an image processing procedure used to characterize the CAM vascular network; a The original 16-bit image; b The same image after the “first phase” thresholding to extract main vessels; c The image after a posteriori shading correction filter; d The second parallel phase after the Laplacian filter; e The result after the conversion to an 8-bit image; f The result after the skeletonization process; g The corresponding histogram of non- vascularized meshes/mm2 (surface distribution of non-vascularized regions). Adapted from [64].
