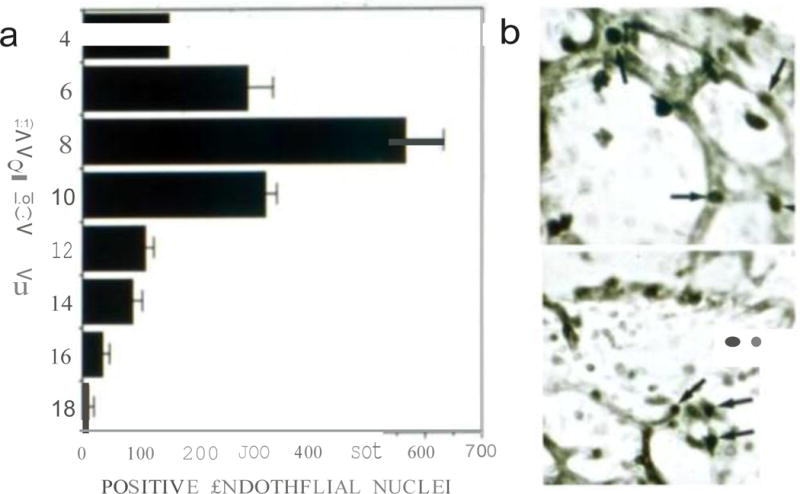
Figure 4.

Proliferation kinetics of CAM vessels. a Quantification of BrdU incorporation in CAM vessels at the indicated days post-fertilization. Counts per time point were the average of positive nuclei in the vessels from 3–4 CAMs per time point; b Example of images used to obtain the measurements. The upper panel represents embryo development at day 4 and lower panel is an example of embryo development at day 6.
