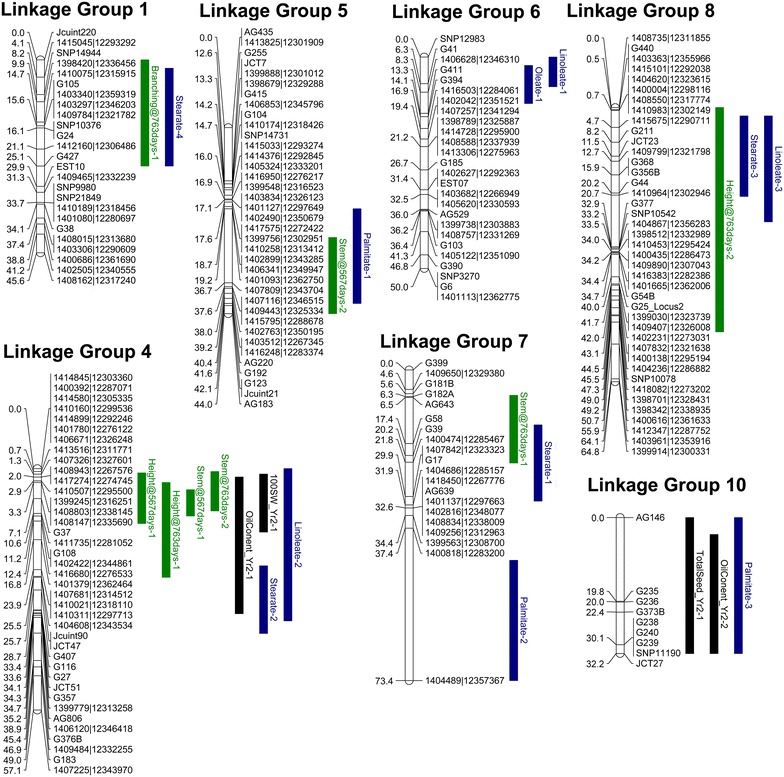
Fig. 4.

Map of QTL detected in mapping population G51 × CV. QTL shown in green relate to vegetative traits (branching, stem diameter and plant height). QTL shown in black relate to seed yield traits (seeds per plant, 100-seed weight or oil content). QTL shown in blue relate to fatty acid composition in the seed oil (palmitate, stearate, oleate or linoleate). Only linkage groups found to contain QTL are shown
