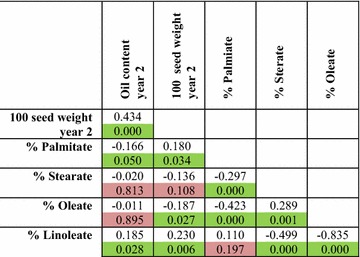
Table 4.
Pearson correlation coefficients for oil content, 100-seed weight and fatty acid composition in the mapping population G51 × CV

The upper uncoloured cells contain the R values. The lower coloured cells contain the p values. Cells shaded in green represent correlations with a p value <0.05 and cells shaded in red represent a p value >0.05. Details of data collection and calculation for each trait are provided in “Methods”
