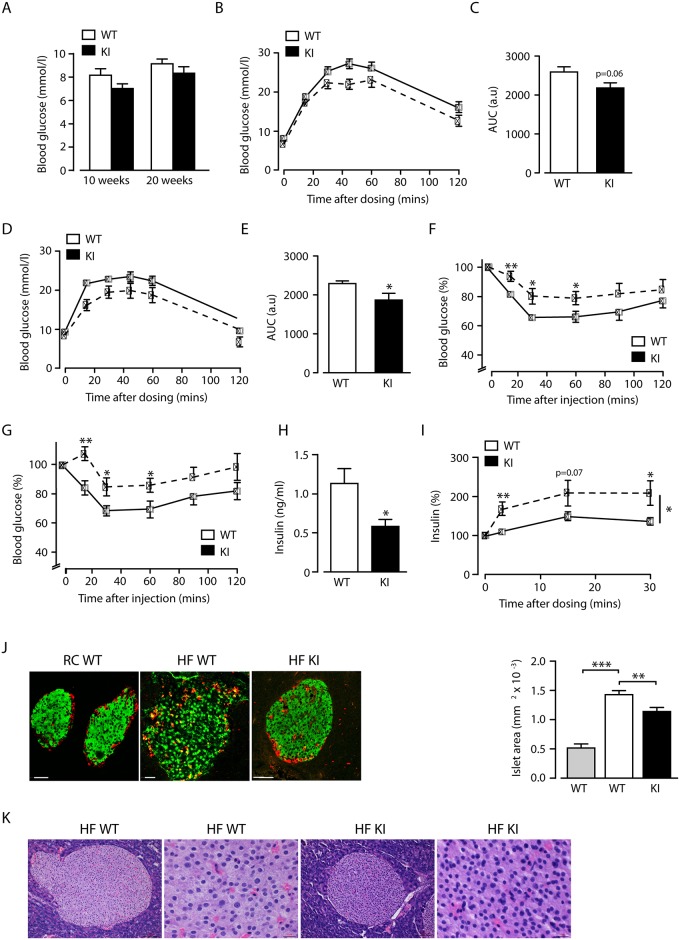
Fig 2. Reduced insulin sensitivity with increased glucose clearance by beta2-integrin knock-in mice fed a high fat diet.
(A) Fasted blood glucose levels after 10 and 20 weeks HF-feeding in mice of the indicted genotypes (B-E) Intraperitoneal glucose tolerance tests were performed on WT and KI mice after 10 (B) and 20 weeks (D) of HF-feeding, with quantification of the total glycaemic excursion (area under the curve; AUC) shown at 10 (C) and 20 (E) weeks. Insulin tolerance tests were performed on WT and KI mice after 10 (F) and 20 (G) weeks of HF-feeding. (H) Fasted blood insulin levels after 20 weeks HF-feeding for WT and KI mice. (I) Glucose stimulated insulin secretion in WT and KI mice after 20 weeks of HF-feeding. n = 8–11. (J) (left panel) Representative confocal images of pancreatic islets from RC- and HF-fed WT and HF-fed KI mice, stained for insulin (green) and glucagon (red). Scale bar is 50 microns. (right panel) Islet areas for RC-fed WT mice (grey bar; n = 20; N = 2); HF-fed WT mice (white bar: n = 25, N = 4) and HF-fed KI mice (black bar). n = 39; N = 4). (K) Representative haematoxylin and eosin staining of pancreas showing no neutrophil infiltration in HF-fed WT and KI mice. Scale bar = 100 μm (in 10x magnification) and 20μm (in 40x magnification). The results are means ± S.E.M. * P < 0.05; ** P < 0.01; *** P < 0.001.

