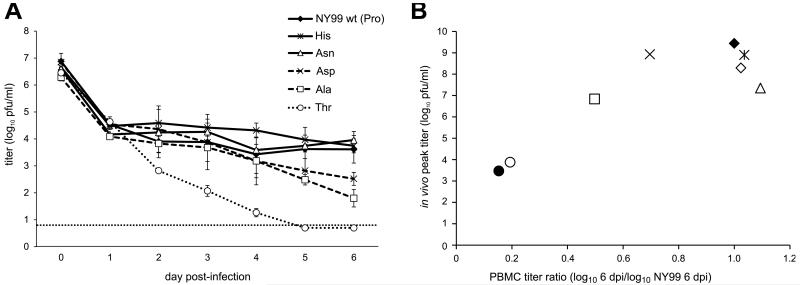
Figure 3.
(A) Growth of WNV NY99 NS3-249 mutants in AMCR PBMCs. NY99 wild-type (NS3-P249) and NS3-P249T mutant data correspond to experiment 7 in Figure 2. The dashed line represents the limit of detection. Error bars represent standard deviation from the mean of three replicates. (B) Scatterplot comparing day 6 PBMC titers to peak in vivo titers in AMCRs. Legend is as in (A), with the addition of KN3829 (black circles) and KN3829-T249P (open diamonds) (Brault et al., 2007; Langevin et al., 2014). R = 0.8726; p = 0.005.

