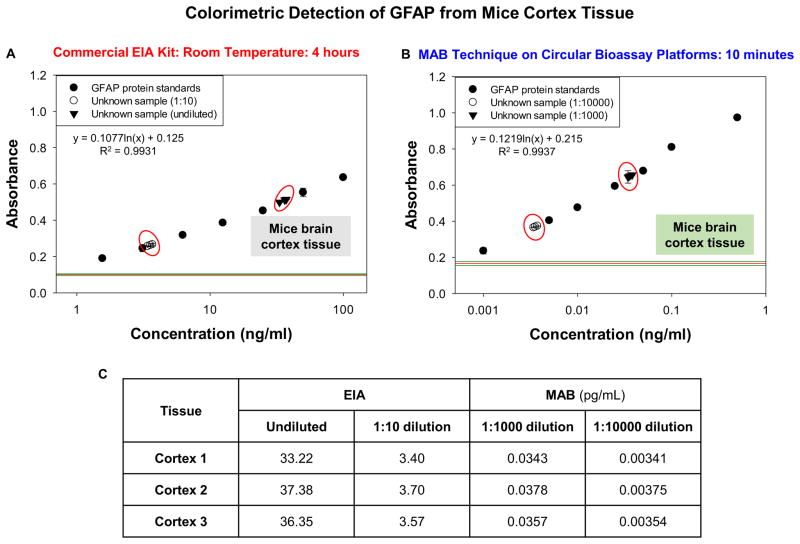
Figure 1.
Colorimetric data obtained from GFAP bioassays conducted at room temperature using commercial EIA kit (A) and with the MAB technique (1 min MW heating for each step) (B). The unknown concentration values for all dilutions used calculated from the plot (C). GFAP samples were collected from mice brain cortex tissue. The MAB technique employed the iCrystal system.

