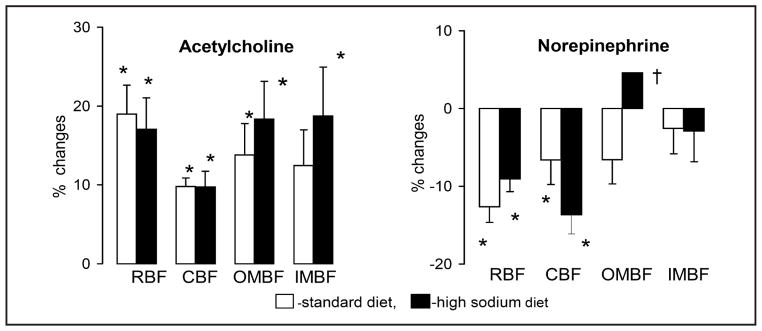
Fig. 2.

Changes in total renal blood flow (RBF) and flows through the cortex (CBF) and outer (OMBF) and inner medulla (IMBF) in response to acetylcholine and norepinephrine infused into renal artery. The data for day 10 of exposure to diets. Means ± SEM, * significantly different from pre-infusion control, † significantly different from standard diet.
