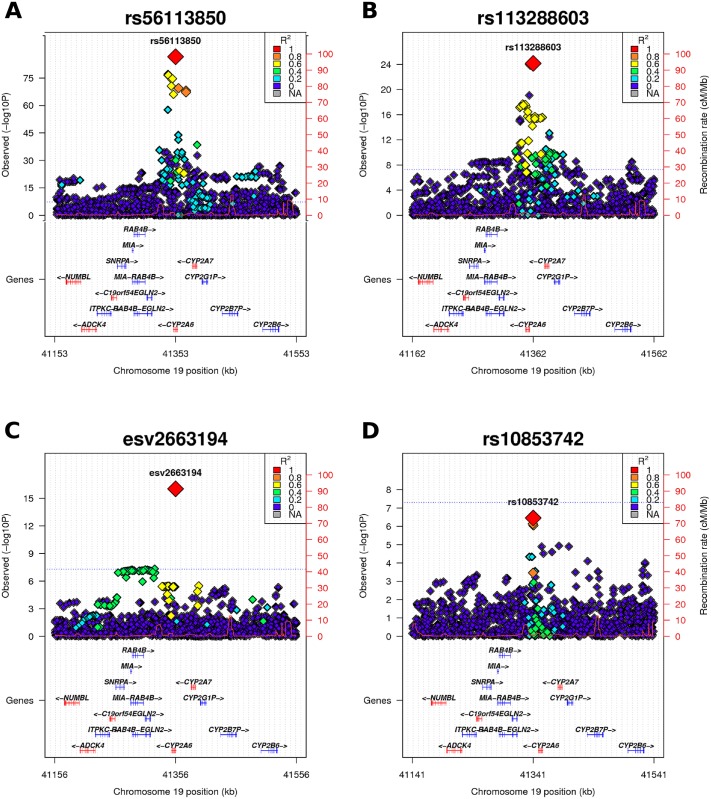
Fig 3. Regional plot of 19q13.2.
(A) In the GWAS meta-analysis a minimum p-value of 5.77E-86 was obtained for rs56113850, in intron 4 of CYP2A6. (B) Analyses conditioned on the top-SNP (rs56113850) revealed rs113288603 as a second independent genome-wide significant signal (pcond = 7.03E-25). (C) Analyses conditioned on the two independent SNPs (rs56113850, rs113288603) revealed esv2663194 as a third independent genome-wide significant signal (pcond = 9.3E-17). (D) Analyses conditioned on the three independent SNPs yielded no additional signal exceeding the genome-wide significance threshold. All plots are generated with LocusTrack [52]. LD (R2) values were obtained from the FINRISK sample (N = 19857).

