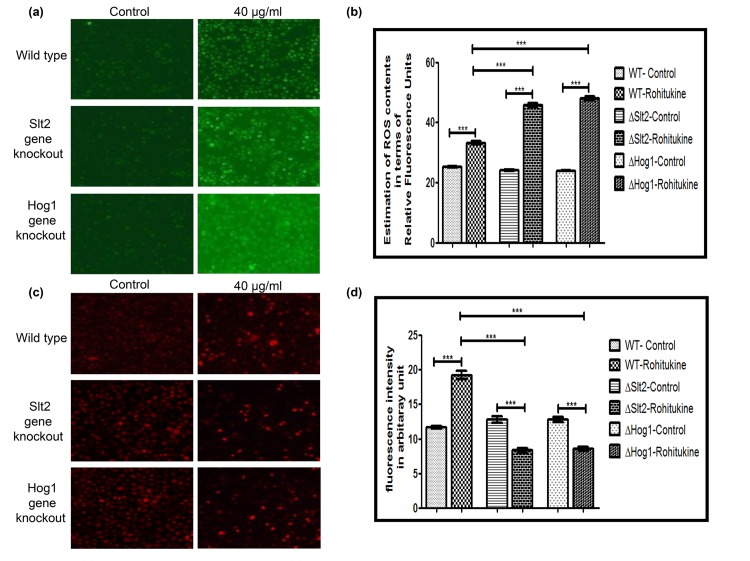
Fig 2. Rohitukine promoted ROS production and loss Mitochondrial content in gene knockout strains of yeast.
(a) DCFDA staining (b) Graphical representation of Relative formation of reactive oxygen species (ROS) measured by H2DCFDA staining in WT and gene knockout strains of yeast as quantified using Image J software ***p < 0.001.(c) Mitotracker Deep Red staining (d) Graphical representation for fluorescence intensity of mitochondrial content of the budding yeast as quantified using Image J software ***p <0.001.

