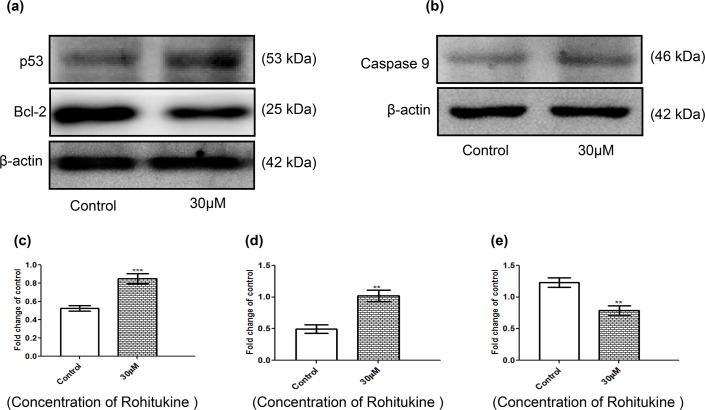
Fig 6. Rohitukine affected the apoptosis-associated protein levels in A549 cells.
Cells were treated with Rohitukine at 30 μM for 24hrs, and then the total proteins were prepared and determined as described in methods. (a) The levels of proteins expression of p53 and Bcl-2 (b) proteins expression of caspase9 were estimated by Western blotting. Band intensities were calculated by densitometry and change in protein expression after Rohitukine treatment was calculated with respect to controls and expressed as fold change in graph. (c), (d) & (e) densitometry for p53, Bcl-2, and caspase9 blot respectively. Results were normalized to β-actin. The data are represented as means ±SD of three independent experiments (** P < 0.01 versus control).

