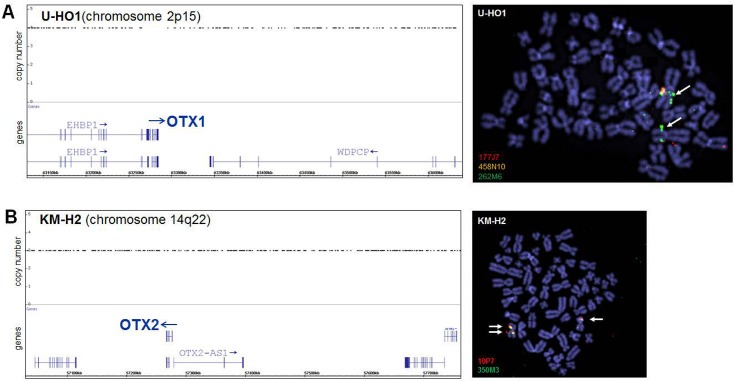
Fig 2. Genomic and chromosomal analysis of OTX loci.
HL cell lines U-HO1 (A) and KM-H2 (B) were analyzed by genomic profiling and FISH. Loci for OTX1 (2p15) in U-HO1 and for OTX2 (14q22) in KM-H2 are duplicated as shown by copy number (left) and FISH analyses (right), demonstrating duplicated and enhanced signals, respectively (arrows). BAC-probes cover (458N10) and flank (177J7, 262M6, 10P7, 350M3) the analyzed genes and are indicated in their labelling fluor colors.

