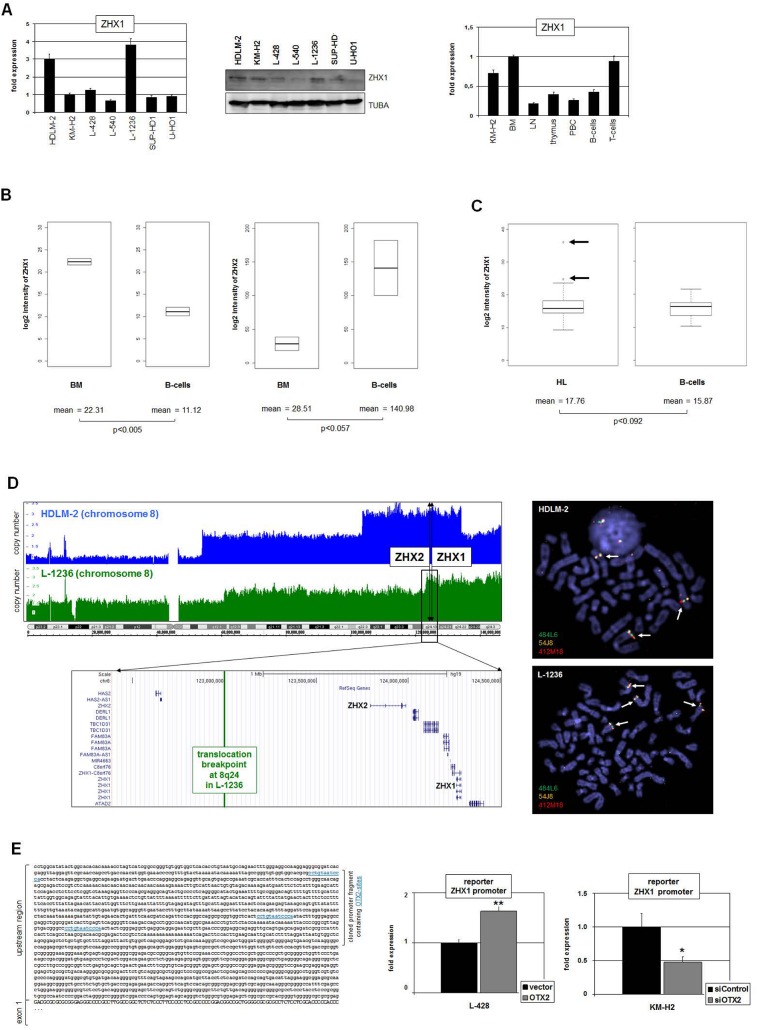
Fig 7. Deregulated expression of ZHX1 in HL.
(A) RQ-PCR (left) and Western blot (middle) analyses of ZHX1 in HL cell lines consistently indicate constitutive activity and enhanced expression in HDLM-2 and L-1236 cells. RQ-PCR analysis of ZHX1 in primary hematopoietic samples (right) shows highest levels in BM and T-cells and reduced expression in LN, thymus, PBC and B-cells. The ZHX1 expression in KM-H2 is elevated and corresponds to the levels observed in BM and T-cells. (B) In silico expression analysis of ZHX1 (left) and ZHX2 (right) in primary BM and B-cell samples (GSE7307). The data show significantly different expression levels for both genes. The expression level of ZHX1 is reduced while that of ZHX2 is elevated in B-cells as compared to BM. (C) In silico expression analysis of ZHX1 in primary samples obtained from HL patients and from B-cells of healthy donors (GSE12453). The expression level of ZHX1 is significantly increased in HL samples as compared to B-cells and shows overexpression in 12% (2/17) HL patients (arrows). (D) Copy number analyses of chromosome 8 (left) and FISH analyses (right) in HL cell lines HDLM-2 and L-1236. The gene loci of ZHX1 and ZHX2 are indicated, showing their localization in amplified regions of both cell lines. While both genes are entirely amplified in HDLM-2, L-1236 contains a chromosomal breakpoint in the upstream region of ZHX2. The FISH results confirm the copy number data, indicating the signals at the gene locus of ZHX1 by arrows. The BACs used were 484L6 (ZHX2), 54J8 (ZHX1) and 412M18 (flanking). (E) Reporter gene assay analyzing the promoter region of ZHX1, containing three potential binding sites for OTX2 as indicated in blue (left). RQ-PCR analysis of the reporter gene in L-428 cells after forced expression of OTX2 (right, above) and in KM-H2 cells after siRNA-mediated knockdown of OTX2 (right, below). Collectively, the data show that OTX2 activates directly the expression of ZHX1 in HL cells.

