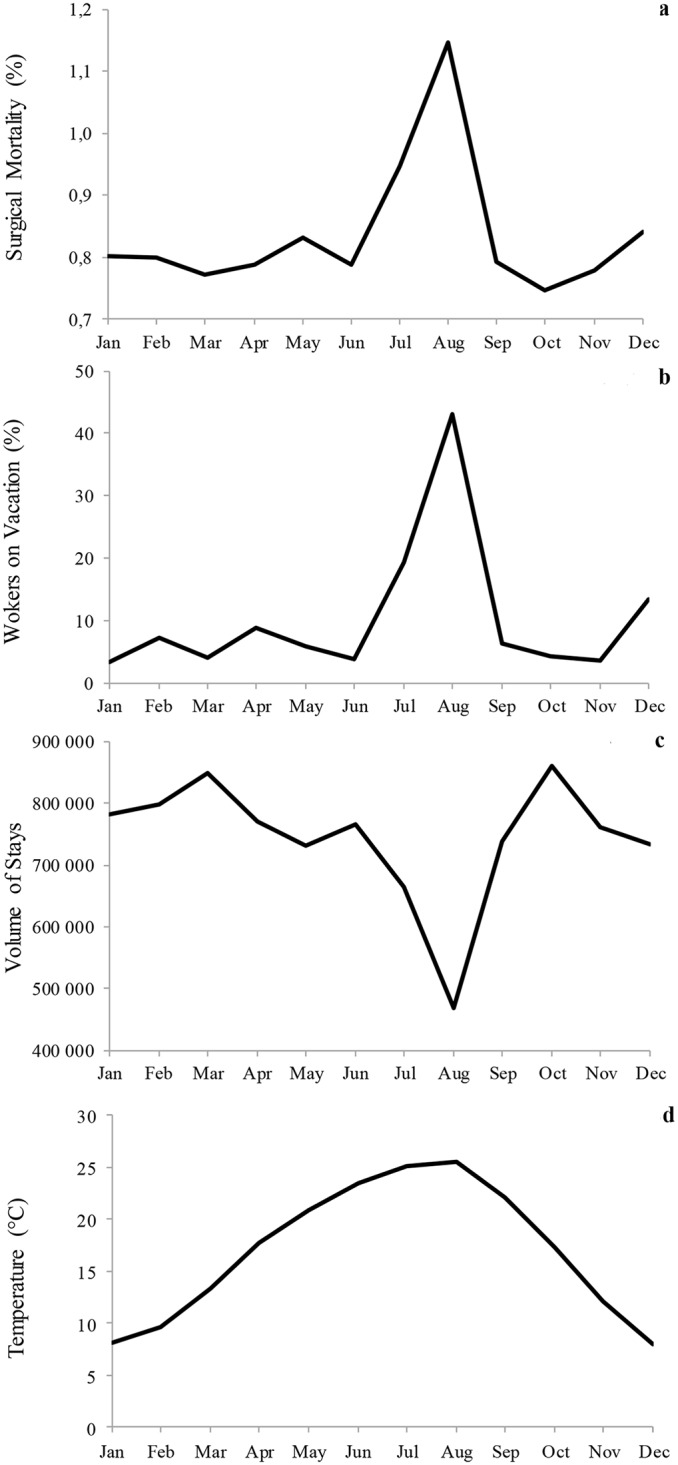
Fig 3. Seasonal pattern of predictors.

The figures present the monthly changes in mortality rates (3a), along with those of workers' leave (3b), hospital activity (3c) and maximum temperatures (3d).

The figures present the monthly changes in mortality rates (3a), along with those of workers' leave (3b), hospital activity (3c) and maximum temperatures (3d).