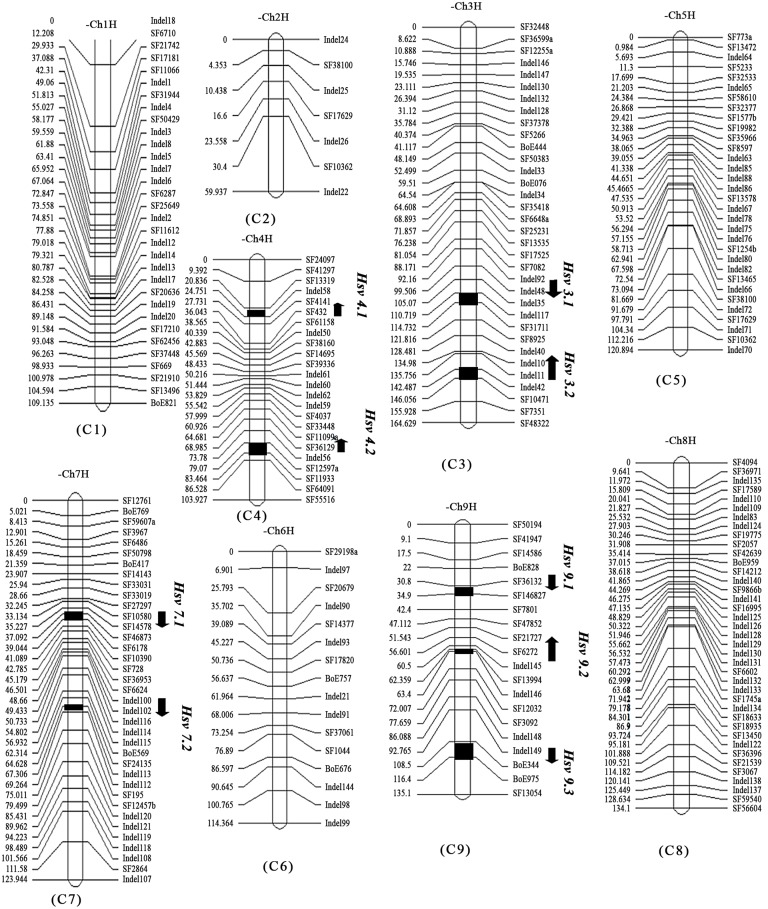
Fig 4. Genetic linkage map and positions of QTLs associated with heading splitting resistance in a cabbage DH population.
Marker locations are listed to the right and recombination distances (cM) to the left of each linkage group. Locations of QTLs are indicated by names and arrows to the right of the linkage groups. Arrows indicate the relative effect of the 96–100 allele with upward for increasing and downward for decreasing.

