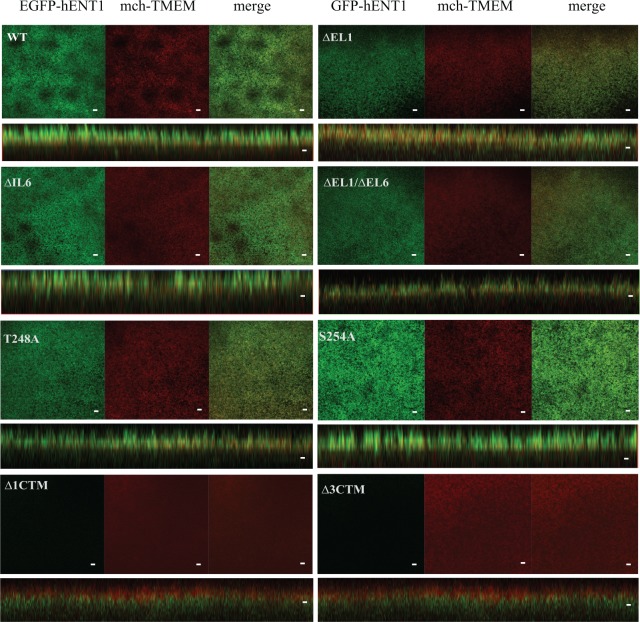
Fig 2. Plasma membrane localization of hENT1 variants.
Fluorescent confocal microscope images of WT hENT1, ∆EL1, ∆IL6, and ∆EL1/∆IL6 loop deletion mutants, T248 and S254A point mutants, and ∆1CTM and ∆3CTM carboxyl-terminus deletion mutant expressed in X. laevis oocytes. Constructs are indicated on the panels. The individual images along the focal plane of the microvilli on the membrane (EGFP in green, mch-TMEM in red) are shown, followed by the merge of EGFP and mch-TMEM in (yellow). Orthogonal sections through Z stacks also show co-localization. Carboxyl-terminal deletions did not show EGFP fluorescence on the membrane. Images are representative of 30 oocytes. Scale bar = 5μm.

