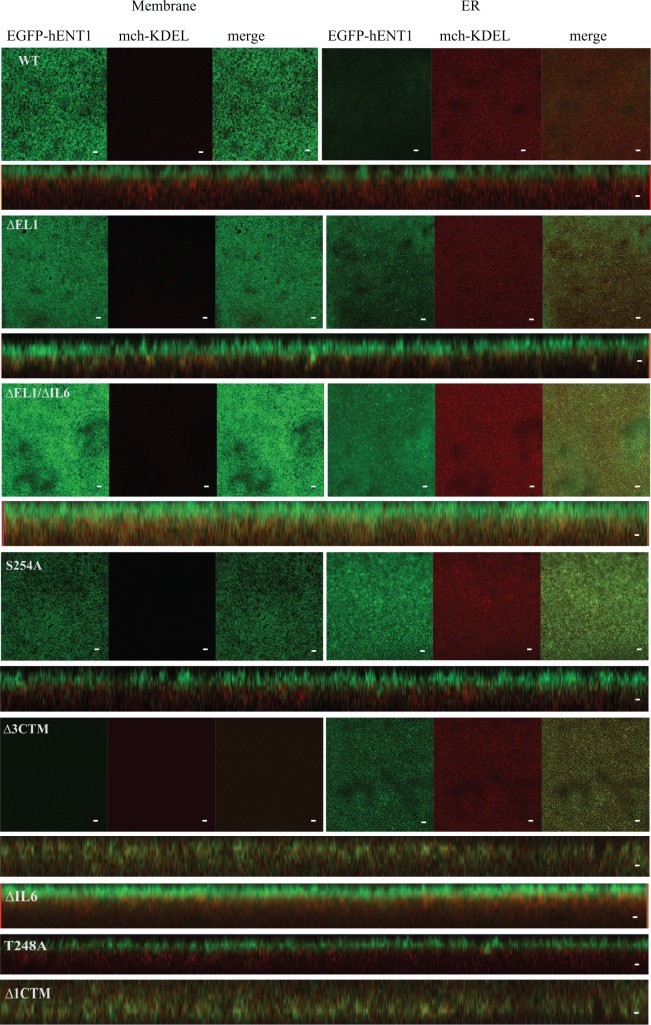
Fig 3. Intracellular distribution of the hENT1 variants.
Shown are the confocal images for WT hENT1, ∆EL1, and ∆EL1/∆IL6 loop deletion mutants, S254A point mutant, ∆3CTM carboxyl-terminus deletion mutant expressed in X. laevis oocytes. Two images were taken: one on the plasma membrane (left panel) and the other deep within the cell showing the ER structure (right panel). Only the orthogonal sections are shown for ∆IL6, T248A and ∆1CTM. Left panel shows normal distribution of EGFP (green) on the membrane and mch-KDEL (red) in the ER for the WT, T248A and S254A. In contrast, ∆EL1, ∆IL6, ∆EL1/∆IL6 shows some co-localization of hENT1 and KDEL in the ER. Carboxyl-terminal deletions did not show EGFP fluorescence on the membrane. Instead, EGFP was present within the ER, co-localized with mch-KDEL. All the confocal images show a single, representative, section of a Z-series taken through the entire cell. Images are representative of 30 oocytes. Scale bar = 5μm.

