
Fig 8. Type I IFN production in BMT mice.
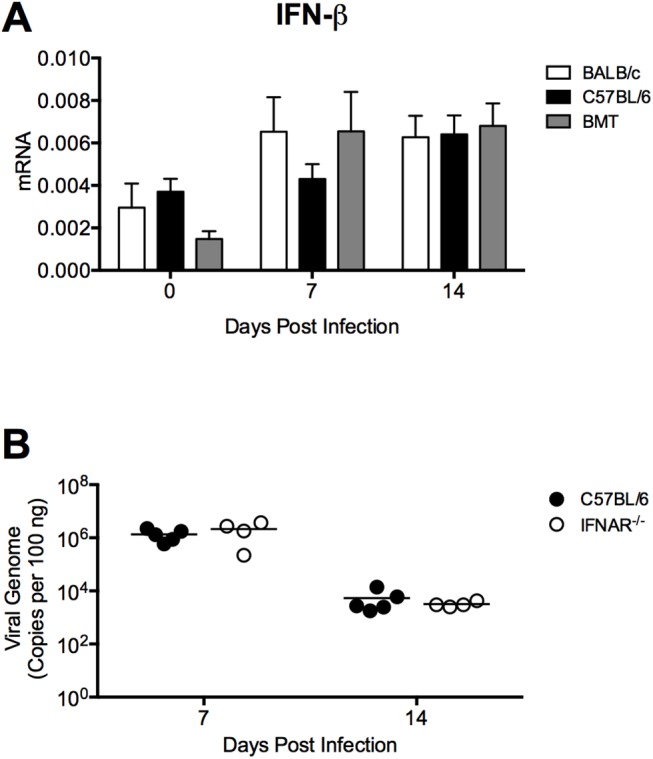
A) BMT mice (BALB/c donor, C57BL/6 recipient) and untransplanted BALB/c and C57BL/6 controls were infected i.n. with MAV-1, and lungs were harvested at the indicated time points. RT-qPCR was used to quantify IFN-β mRNA levels. Combined data from n = 7–8 mice per group (n = 3 per group at day 0) are presented as means ± S.E.M. Statistical comparisons were made using two-way ANOVA followed by Bonferroni’s multiple comparison tests. B) Untransplanted C57BL/6 and IFNAR-/- mice were infected i.n. with MAV-1. DNA was extracted from lungs harvested at the indicated time points. qPCR was used to quantify MAV-1 genome copies in lung DNA. DNA viral loads are expressed as copies of MAV-1 genome per 100 ng of input DNA. Individual circles represent values for individual mice and horizontal bars represent means for each group. Statistical comparisons were made using two-way ANOVA followed by Bonferroni’s multiple comparison tests.