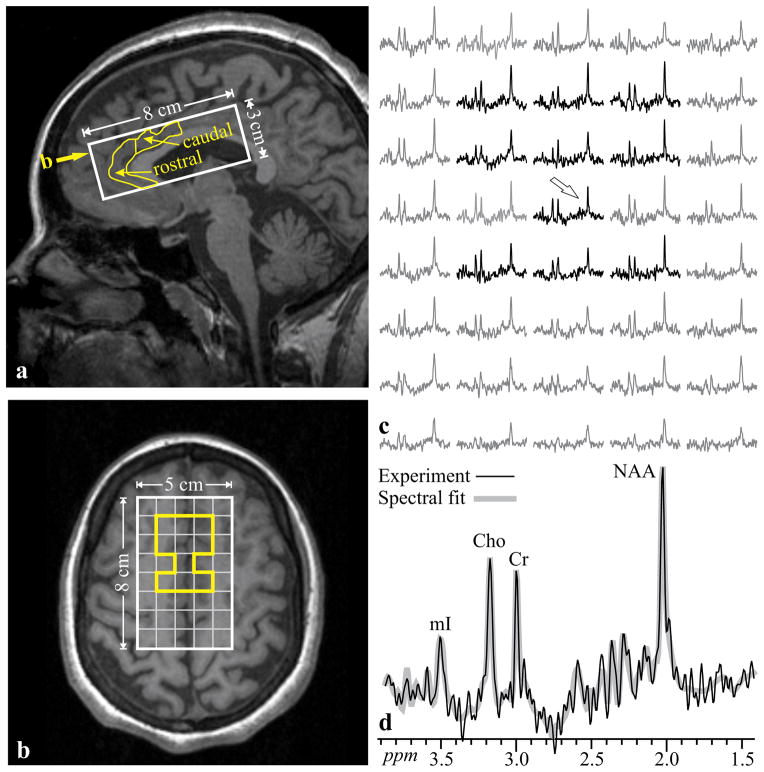
Fig. 1.
(a) Sagittal and T1-weighted image from a 29 year-old woman with schizophrenia (#14 in Table 1) superimposed with the 5×8×3 cm3 (LR×AP×IS) VOI (solid white line) and manually delineated ACC (yellow line) with its rostral and caudal parts. Yellow arrow denotes the level of b. (b) Axial slice from the level denoted by yellow arrow on a, showing the the 5×8 cm (LR×AP) VOI and 1×1 cm MRSI grid (white frame, yellow-highlighted voxels contain ACC). Note that ACC voxels are away from the VOI edges and do not incur chemical-shift-displacement errors. (c) Real part of the spectra from the 5×8 VOI voxel matrix in b, each representing 0.5 cm3, on common frequency (1.7 – 4.0 ppm) and intensity scales. Spectra within the ACC (yellow region on b) are black, outside - gray. (d) Spectrum indicated by arrow on c, expanded to show details, superimposed with its spectral-fit. Note the signal-to-noise ratio, excellent spectral resolution (5.3±1.2 Hz linewidth) and spectral fitting fidelity, from these 0.5 cm3 voxels in ~30 minute 1H-MRSI acquisition

