
Figure 5.
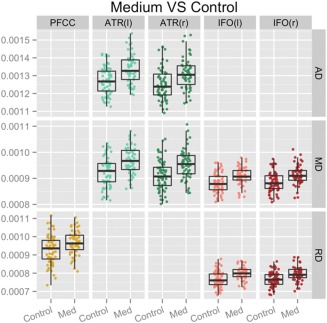
Detailed differences in DTI scalars between control and Medium CAP groups. Plots of mean DTI scalars across tract skeleton voxels that contained significant differences between control and Medium CAP groups for each participant. These results were acquired with the threshold‐free cluster enhancement method at 50,000 permutations and corrected with FDR at a criterion of q < 0.05 for left (l) and right (r). Abbreviations: PFCC, anatomical prefrontal WM tracts of the corpus callosum; ATR(l), anterior thalamic radiations left; ATR(r), anterior thalamic radiations right; IFO(l), inferior fronto‐occipital fasciculus left; IFO(r), inferior fronto‐occipital fasciculus right; AD, axial diffusivity; MD, mean diffusivity; RD, radial diffusivity; Med, medium.