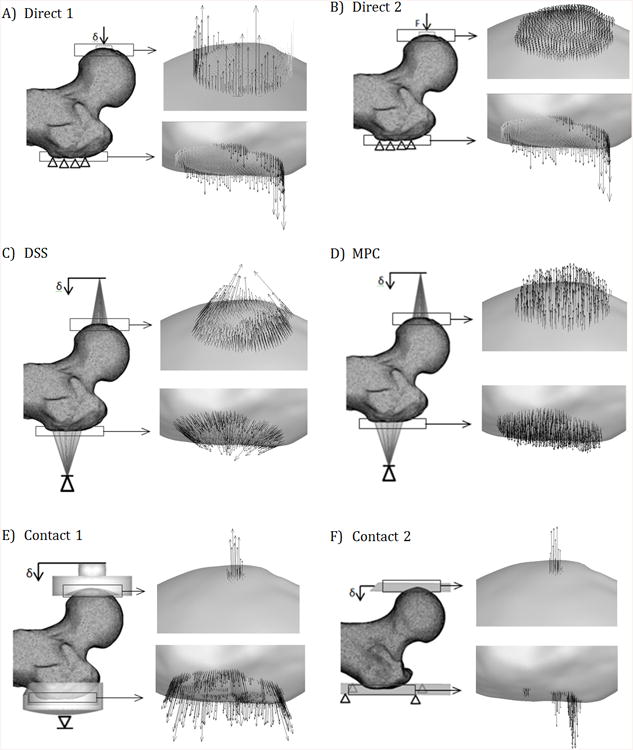
Figure 5.

Typical QCT/FEA reaction force distributions at a femoral head displacement of 1 mm. Black arrows represent compressive forces acting toward the test fixture; grey arrows (only present in a and b) represent unphysical tensile forces acting away from fixtures.
