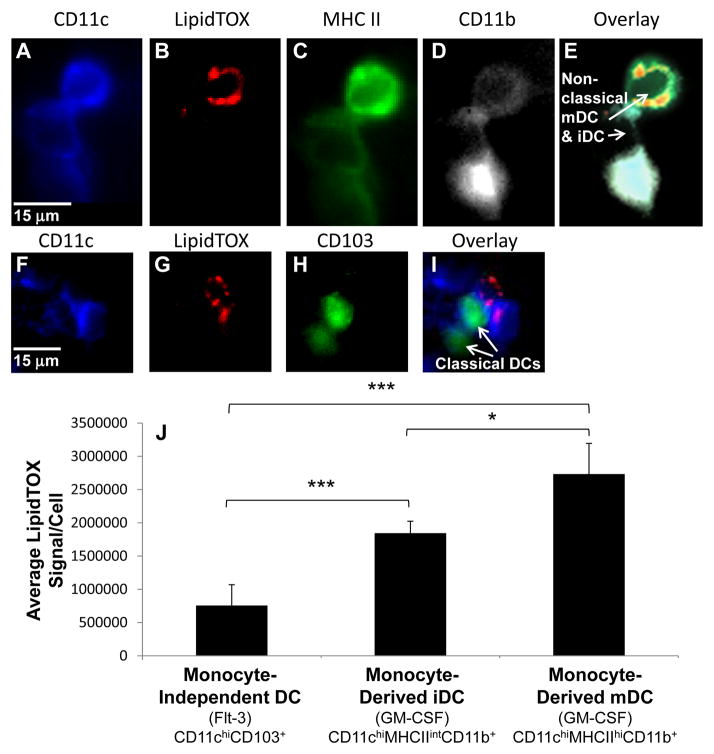
Figure 6. Lipid accumulation in DCs isolated from murine atherosclerotic plaques parallels in vitro results.
Cells present in atherosclerotic plaques of 5 ApoE−/− mice on a high fat diet for 12 weeks were isolated and stained with monoclonal antibodies, for dissecting DC subsets, and LipidTOX-Red, for quantifying neutral lipid content. Quantitative analysis was used to delineate DC subsets. (A–E) Examples of a CD11chiMHCIIintCD11b+ moncyte-derived iDC and a CD11chiMHCIIhiCD11b+ monocyte-derived mDC (arrows, E). Cells with high CD11b expression were excluded from analysis. (F–I) Examples of CD103+CD11c+ monocyte-independent DCs (arrows, I). (J) Quantification of the LipidTOX signal per cell for each DC subset. Error bars represent the sem. * p ≤ 0.05, *** p ≤ 0.001 Kruskal-Wallis test followed by Wilcoxon rank-sum test.

