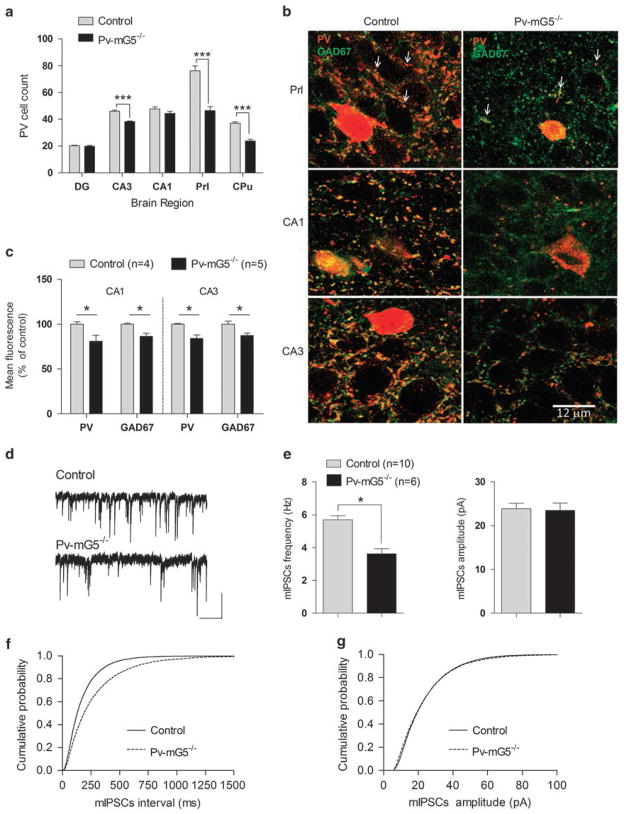
Figure 1.
Postnatal deletion of metabotropic glutamate receptor 5 (mGluR5) in Pv+ interneurons produced lasting alterations in interneuron development and function. (a) Reduced numbers of Pv+ cells were observed in the prelimbic cortex (genotype: F(1,8) = 41.45, P <0.001), CA3 region of the hippocampus (genotype: F(1,8) = 63.12, P <0.001) and caudate putamen (genotype: F(1,9) = 72.12, P <0.001). No significant reduction of Pv+ cells was observed in the dentate gyrus (genotype: F(1,8) = 0.6, P = 0.4) or CA1 region of the hippocampus (genotype: F(1,8) = 2.54, P = 0.1). Control: n = 5 for the DG, CA3, CA1 and Prl; n = 6 for the Cpu. Pv-mG5 −/−: n =5 for all regions. (b) Representative images of prelimbic cortex and hippocampal slices showed reduced Pv+ basket-type synaptic contacts (red dot-like structures, arrows in image) in Pv-mG5−/− mice. Scale bar =12 μm. (c) Quantification of the remaining Pv+ synaptic contacts in Pv-mG5−/− mice showed decreased expression of parvalbumin and GAD67 compared with control mice in the CA1 (genotype: GAD67, F(1,7) = 10.97, P <0.05; Pv, F(1,7) = 20.67, P <0.01) and CA3 (genotype: GAD67, F(1,7) = 9.06, P <0.05; Pv, F(1,7) = 12.77, P <0.01) regions of the hippocampus. (d) Representative miniature inhibitory postsynaptic currents (mIPSCs) recorded in pyramidal CA1 neurons of control and Pv-mG5−/− mice in the presence of the Na+ channel blocker TTX (0.5–1 μM), the α-amino-3-hydroxy-5-methyl-4-isoxazolepropionic acid receptor antagonist CNQX (25 μM) and the NMDA receptor antagonist APV (10 μM). High Cl− concentration in the internal solution made mIPSCs inward (scale bars =25 pA and 1 s). (e) Summary plots of mIPSCs show that mean frequency but not mean amplitude was decreased in Pv-mG5−/− mice (P<0.05, Student’s t-test). (e and f) Pooled cumulative distributions for the inter-event intervals and amplitudes of mIPSCs in Pv-mG5−/− mice are shown in f and g, respectively. Data were obtained from 7- to 12-week-old male mice. Bar graphs depict means ± s.e.m. APV, (2R)-amino-5-phosphonovaleric acid; CA1, Cornu Ammonis region 1; CA3, Cornu Ammonis region 3; CNQX, 6-cyano-7-nitroquinoxaline-2,3-dione; Cpu, caudate putamen; DG, dentate gyrus; Prl, prelimbic region; TTX, tetrodotoxin.

