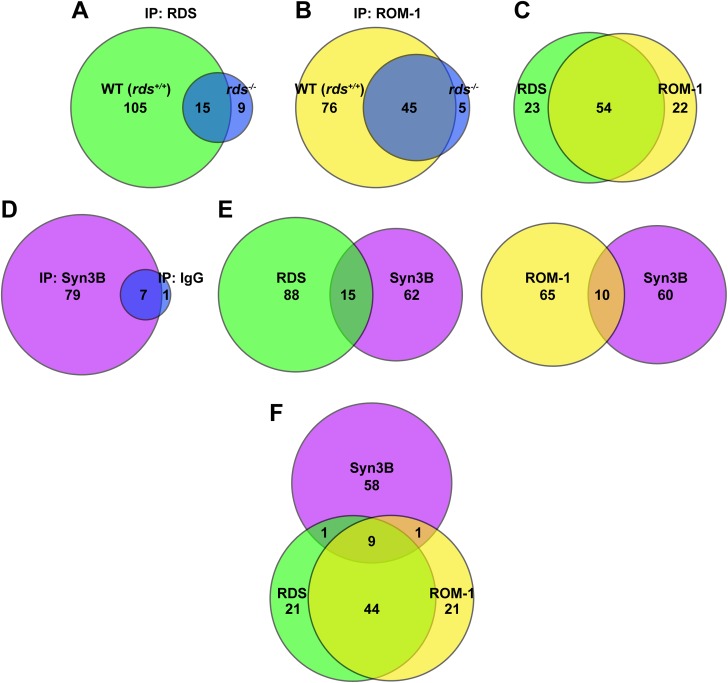
Fig 1. RDS/ROM-1 share interacting partners with each other and Syn3B.
Euler diagrams depicting results from LC-MS studies to identify RDS/ROM-1 interacting partners. Numbers in each diagram represent proteins identified. A-B. WT and rds -/- retinal extracts were IPed using RDS mAB 2E7 (A) or ROM1 mAB 2H5 (B), cross-linked to sepharose followed by LC-MS. C. This diagram depicts overlap between proteins identified in RDS pull-down (A) and ROM-1 pull down (B) after subtraction of negative controls (blue circles A-B). D. WT retinal extracts were IPed with anti-Syn3B-SySy or IgG coupled to protein A beads followed by LC-MS. E-F. These diagrams depict overlap between proteins in the RDS (E-left) or ROM-1 (E-right) IP and the Syn3B IP, or overlap between all three (F).

