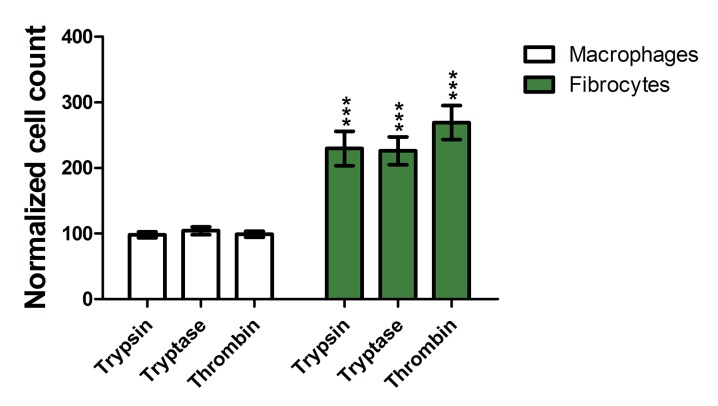
Fig 3. Proteases increase fibrocyte numbers when added to PBMC.
Cellprofiler counts of fibrocytes and macrophages from slides used for Fig 1 were normalized as a percent of controls. Values are mean ± SEM, n = 6. *** indicates p < .001 compared to the no-protease control (unpaired two-tailed t-tests).

