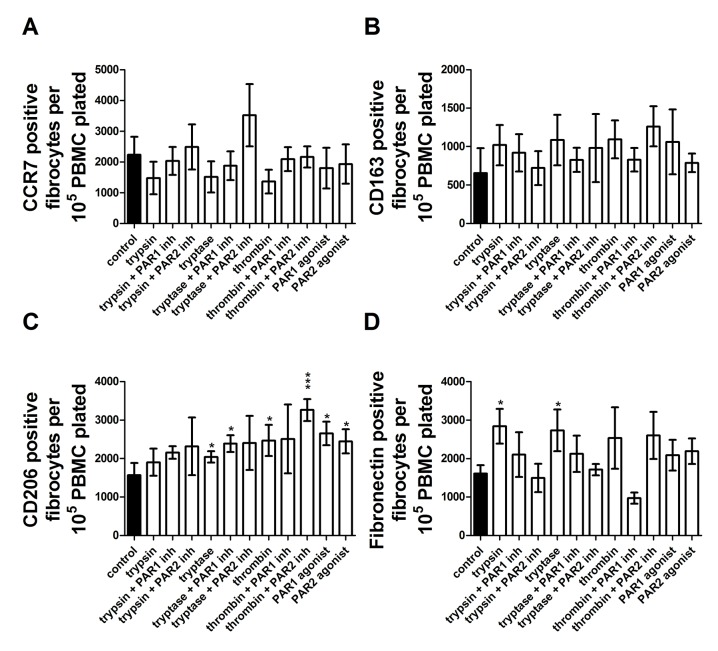
Fig 15. Proteases induce changes in fibrocyte marker expression through activation of PAR-1 and PAR-2.
PBMC were cultured as in Fig 1, and after five days of treatment by PAR agonists, proteases, or proteases in the presence of PAR-1 or PAR-2 inhibitors, were analyzed as in Fig 1B. (A) CCR7 positive fibrocytes, (B) CD163 positive fibrocytes, (C) CD206 positive fibrocytes, and (D) fibronectin positive fibrocytes. Values are mean ± SEM, n = 6. * indicates p < .05 and *** indicates p < .001 compared to the no-protease control (paired two-tailed t-tests).

